
Page 81 - Read Online
P. 81
Page 120 Yang et al. Intell Robot 2024;4(1):107-24 I http://dx.doi.org/10.20517/ir.2024.07
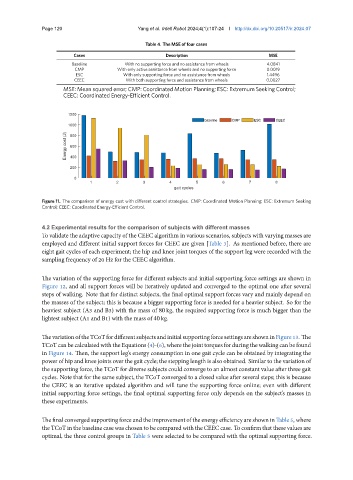
Table 4. The MSE of four cases
Cases Description MSE
Baseline With no supporting force and no assistance from wheels 4.0841
CMP With only active assistance from wheels and no supporting force 0.0019
ESC With only supporting force and no assistance from wheels 1.4496
CEEC With both supporting force and assistance from wheels 0.0027
MSE: Mean squared error; CMP: Coordinated Motion Planning; ESC: Extremum Seeking Control;
CEEC: Coordinated Energy-Efficient Control.
1200
baseline CMP ESC CEEC
1000
Energy cost (J) 800
600
400
200
0
1 2 3 4 5 6 7 8
gait cycles
Figure 11. The comparison of energy cost with different control strategies. CMP: Coordinated Motion Planning; ESC: Extremum Seeking
Control; CEEC: Coordinated Energy-Efficient Control.
4.2 Experimental results for the comparison of subjects with different masses
To validate the adaptive capacity of the CEEC algorithm in various scenarios, subjects with varying masses are
employed and different initial support forces for CEEC are given [Table 3]. As mentioned before, there are
eight gait cycles of each experiment; the hip and knee joint torques of the support leg were recorded with the
sampling frequency of 20 Hz for the CEEC algorithm.
The variation of the supporting force for different subjects and initial supporting force settings are shown in
Figure 12, and all support forces will be iteratively updated and converged to the optimal one after several
steps of walking. Note that for distinct subjects, the final optimal support forces vary and mainly depend on
the masses of the subject; this is because a bigger supporting force is needed for a heavier subject. So for the
heaviest subject (A3 and B3) with the mass of 80 kg, the required supporting force is much bigger than the
lightest subject (A1 and B1) with the mass of 40 kg.
ThevariationoftheTCoTfordifferentsubjectsandinitialsupportingforcesettingsareshowninFigure13. The
TCoTcanbecalculatedwiththeEquations(4)-(6), wherethejointtorquesforduringthewalkingcanbefound
in Figure 14. Then, the support leg’s energy consumption in one gait cycle can be obtained by integrating the
power of hip and knee joints over the gait cycle; the stepping length is also obtained. Similar to the variation of
the supporting force, the TCoT for diverse subjects could converge to an almost constant value after three gait
cycles. Note that for the same subject, the TCoT converged to a closed value after several steps; this is because
the CEEC is an iterative updated algorithm and will tune the supporting force online; even with different
initial supporting force settings, the final optimal supporting force only depends on the subject’s masses in
these experiments.
Thefinal converged supportingforceandthe improvementof theenergy efficiency are shown in Table5, where
the TCoT in the baseline case was chosen to be compared with the CEEC case. To confirm that these values are
optimal, the three control groups in Table 5 were selected to be compared with the optimal supporting force.