
Page 82 - Read Online
P. 82
Yang et al. Intell Robot 2024;4(1):107-24 I http://dx.doi.org/10.20517/ir.2024.07 Page 121
800 A1 A2 A3
B1 B2 B3
700
support force (N) 600
500
400
300
200
0 2 4 6 8 10 12 14 16
time (s)
Figure 12. The variation of the supporting force during walking.
500
A1 A2 A3
B1 B2 B3
400
TCoT (J/m) 300
200
100
0
0 1 2 3 4 5 6 7 8
gait cycles
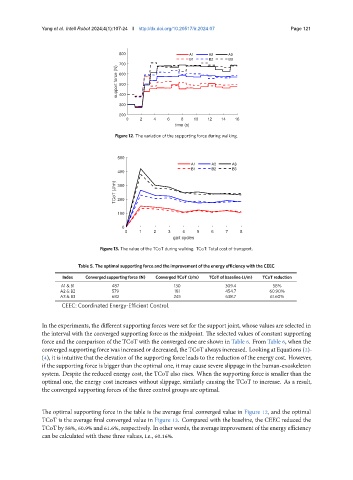
Figure 13. The value of the TCoT during walking. TCoT: Total cost of transport.
Table 5. The optimal supporting force and the improvement of the energy efficiency with the CEEC
Index Converged supporting force (N) Converged TCoT (J/m) TCoT of baseline (J/m) TCoT reduction
A1 & B1 487 130 309.4 58%
A2 & B2 579 181 454.7 60.90%
A3 & B3 682 245 638.7 61.60%
CEEC: Coordinated Energy-Efficient Control.
In the experiments, the different supporting forces were set for the support joint, whose values are selected in
the interval with the converged supporting force as the midpoint. The selected values of constant supporting
force and the comparison of the TCoT with the converged one are shown in Table 6. From Table 6, when the
converged supporting force was increased or decreased, the TCoT always increased. Looking at Equations (2)-
(4), it is intuitive that the elevation of the supporting force leads to the reduction of the energy cost. However,
if the supporting force is bigger than the optimal one, it may cause severe slippage in the human-exoskeleton
system. Despite the reduced energy cost, the TCoT also rises. When the supporting force is smaller than the
optimal one, the energy cost increases without slippage, similarly causing the TCoT to increase. As a result,
the converged supporting forces of the three control groups are optimal.
The optimal supporting force in the table is the average final converged value in Figure 12, and the optimal
TCoT is the average final converged value in Figure 13. Compared with the baseline, the CEEC reduced the
TCoT by 58%, 60.9% and 61.6%, respectively. In other words, the average improvement of the energy efficiency
can be calculated with these three values, i.e., 60.16%.