Page 78 - Read Online
P. 78

Yang et al. Intell Robot 2024;4(1):107-24  I http://dx.doi.org/10.20517/ir.2024.07  Page 117


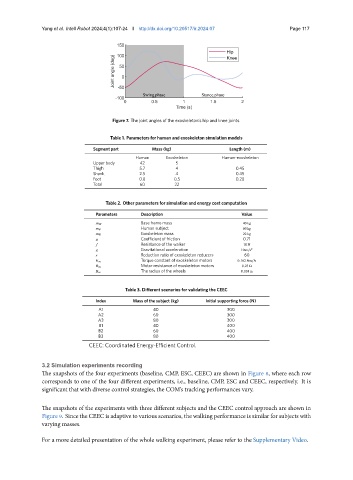
                                       Figure 7. The joint angles of the exoskeleton’s hip and knee joints.


                                      Table 1. Parameters for human and exoskeleton simulation models
                                Segment part        Mass (kg)                 Length (m)
                                               Human     Exoskeleton        Human-exoskeleton
                                Upper body      42          5
                                Thigh           5.7         4                    0.45
                                Shank           2.5         4                    0.45
                                Foot            0.8         0.5                  0.28
                                Total           60          22


                                     Table 2. Other parameters for simulation and energy cost computation

                                 Parameters      Description                      Value
                                                 Base frame mass                   40 kg
                                                 Human subject                     60 kg
                                                 Exoskeleton mass                  22 kg
                                                 Coefficient of friction           0.71
                                                 Resistance of the walker          10 N
                                                 Gravitational acceleration       10 m/s 2
                                                 Reduction ratio of exoskeleton reducers  60
                                                 Torque constant of exoskeleton motors  0.162 Nm/A
                                                 Motor resistance of exoskeleton motors  0.23 Ω
                                                 The radius of the wheels         0.038 m

                                           Table 3. Different scenarios for validating the CEEC

                                 Index        Mass of the subject (kg)  Initial supporting force (N)
                                  A1                 40                       300
                                  A2                 60                       300
                                  A3                 80                       300
                                  B1                 40                       400
                                  B2                 60                       400
                                  B3                 80                       400
                               CEEC: Coordinated Energy-Efficient Control.


               3.2 Simulation experiments recording
               The snapshots of the four experiments (baseline, CMP, ESC, CEEC) are shown in Figure 8, where each row
               corresponds to one of the four different experiments, i.e., baseline, CMP, ESC and CEEC, respectively. It is
               significant that with diverse control strategies, the COM’s tracking performances vary.


               The snapshots of the experiments with three different subjects and the CEEC control approach are shown in
               Figure 9. Since the CEEC is adaptive to various scenarios, the walking performance is similar for subjects with
               varying masses.


               For a more detailed presentation of the whole walking experiment, please refer to the Supplementary Video.
   73   74   75   76   77   78   79   80   81   82   83