
Page 83 - Read Online
P. 83
Page 122 Yang et al. Intell Robot 2024;4(1):107-24 I http://dx.doi.org/10.20517/ir.2024.07
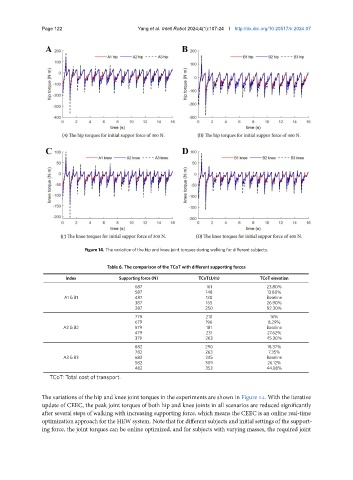
Figure 14. The variation of the hip and knee joint torques during walking for different subjects.
Table 6. The comparison of the TCoT with different supporting forces
Index Supporting force (N) TCoT(J/m) TCoT elevation
687 161 23.80%
587 148 13.80%
A1 & B1 487 130 Baseline
387 165 26.90%
287 250 92.30%
779 210 16%
679 196 8.29%
A2 & B2 579 181 Baseline
479 231 27.62%
379 263 45.30%
882 290 18.37%
782 263 7.35%
A3 & B3 682 245 Baseline
582 309 26.12%
482 353 44.08%
TCoT: Total cost of transport.
The variations of the hip and knee joint torques in the experiments are shown in Figure 14. With the iterative
update of CEEC, the peak joint torques of both hip and knee joints in all scenarios are reduced significantly
after several steps of walking with increasing supporting force, which means the CEEC is an online real-time
optimization approach for the HEW system. Note that for different subjects and initial settings of the support-
ing force, the joint torques can be online optimized, and for subjects with varying masses, the required joint