
Page 55 - Read Online
P. 55
Tong et al. Intell Robot 2024;4:125-45 I http://dx.doi.org/10.20517/ir.2024.08 Page 133
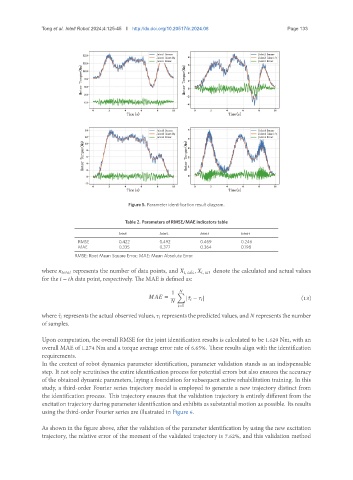
Figure 5. Parameter identification result diagram.
Table 2. Parameters of RMSE/MAE indicators table
Joint1 Joint2 Joint3 Joint4
RMSE 0.422 0.492 0.469 0.246
MAE 0.335 0.377 0.364 0.198
RMSE: Root Mean Square Error; MAE: Mean Absolute Error.
where represents the number of data points, and , calc , , act denote the calculated and actual values
for the − ℎ data point, respectively. The MAE is defined as:
1 Õ
= | ˆ − | (13)
=1
where ˆ represents the actual observed values, represents the predicted values, and represents the number
of samples.
Upon computation, the overall RMSE for the joint identification results is calculated to be 1.629 Nm, with an
overall MAE of 1.274 Nm and a torque average error rate of 6.65%. These results align with the identification
requirements.
In the context of robot dynamics parameter identification, parameter validation stands as an indispensable
step. It not only scrutinises the entire identification process for potential errors but also ensures the accuracy
of the obtained dynamic parameters, laying a foundation for subsequent active rehabilitation training. In this
study, a third-order Fourier series trajectory model is employed to generate a new trajectory distinct from
the identification process. This trajectory ensures that the validation trajectory is entirely different from the
excitation trajectory during parameter identification and exhibits as substantial motion as possible. Its results
using the third-order Fourier series are illustrated in Figure 6.
As shown in the figure above, after the validation of the parameter identification by using the new excitation
trajectory, the relative error of the moment of the validated trajectory is 7.62%, and this validation method