
Page 54 - Read Online
P. 54
Page 132 Tong et al. Intell Robot 2024;4:125-45 I http://dx.doi.org/10.20517/ir.2024.08
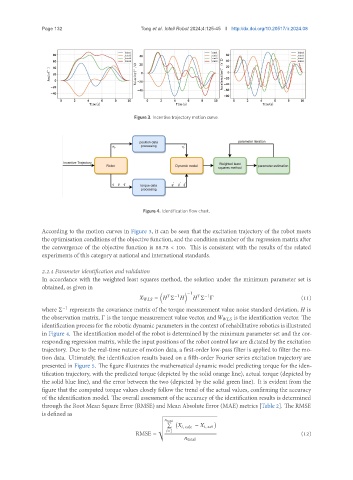
Figure 3. Incentive trajectory motion curve.
Figure 4. Identification flow chart.
According to the motion curves in Figure 3, it can be seen that the excitation trajectory of the robot meets
the optimisation conditions of the objective function, and the condition number of the regression matrix after
the convergence of the objective function is 88.78 < 100. This is consistent with the results of the related
experiments of this category at national and international standards.
2.2.4 Parameter identification and validation
In accordance with the weighted least squares method, the solution under the minimum parameter set is
obtained, as given in
−1
−1
−1
= Σ Σ Γ (11)
where Σ represents the covariance matrix of the torque measurement value noise standard deviation, is
−1
the observation matrix, Γ is the torque measurement value vector, and is the identification vector. The
identification process for the robotic dynamic parameters in the context of rehabilitative robotics is illustrated
in Figure 4. The identification model of the robot is determined by the minimum parameter set and the cor-
responding regression matrix, while the input positions of the robot control law are dictated by the excitation
trajectory. Due to the real-time nature of motion data, a first-order low-pass filter is applied to filter the mo-
tion data. Ultimately, the identification results based on a fifth-order Fourier series excitation trajectory are
presented in Figure 5. The figure illustrates the mathematical dynamic model predicting torque for the iden-
tification trajectory, with the predicted torque (depicted by the solid orange line), actual torque (depicted by
the solid blue line), and the error between the two (depicted by the solid green line). It is evident from the
figure that the computed torque values closely follow the trend of the actual values, confirming the accuracy
of the identification model. The overall assessment of the accuracy of the identification results is determined
through the Root Mean Square Error (RMSE) and Mean Absolute Error (MAE) metrics [Table 2]. The RMSE
is defined as
v
u
u total
u Í
t
, calc − , act
=1
RMSE = (12)
total