
Page 778 - Read Online
P. 778
Page 6 of 11 Yoneoka et al. Hepatoma Res 2020;6:67 I http://dx.doi.org/10.20517/2394-5079.2020.57
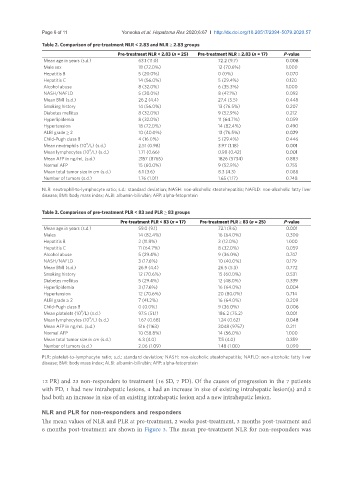
Table 2. Comparison of pre-treatment NLR < 2.83 and NLR ≥ 2.83 groups
Pre-treatment NLR < 2.83 (n = 25) Pre-treatment NLR ≥ 2.83 (n = 17) P-value
Mean age in years (s.d.) 63.1 (11.0) 72.2 (9.7) 0.008
Male sex 18 (72.0%) 12 (70.6%) 1.000
Hepatitis B 5 (20.0%) 0 (0%) 0.070
Hepatitis C 14 (56.0%) 5 (29.4%) 0.120
Alcohol abuse 8 (32.0%) 6 (35.3%) 1.000
NASH/NAFLD 5 (20.0%) 8 (47.1%) 0.092
Mean BMI (s.d.) 26.2 (4.4) 27.4 (5.5) 0.448
Smoking history 14 (56.0%) 13 (76.5%) 0.207
Diabetes mellitus 8 (32.0%) 9 (52.9%) 0.212
Hyperlipidemia 8 (32.0%) 11 (64.7%) 0.059
Hypertension 18 (72.0%) 14 (82.4%) 0.490
ALBI grade ≥ 2 10 (40.0%) 13 (76.5%) 0.029
Child-Pugh class B 4 (16.0%) 5 (29.4%) 0.446
9
Mean neutrophils (10 /L) (s.d.) 2.51 (0.98) 3.97 (1.18) 0.001
9
Mean lymphocytes (10 /L) (s.d.) 1.71 (0.66) 0.98 (0.42) 0.001
Mean AFP in ng/mL (s.d.) 2157 (8765) 1826 (5734) 0.883
Normal AFP 15 (60.0%) 9 (52.9%) 0.755
Mean total tumor size in cm (s.d.) 6.1 (3.6) 8.3 (4.3) 0.088
Number of tumors (s.d.) 1.76 (1.01) 1.65 (1.17) 0.748
NLR: neutrophil-to-lymphocyte ratio; s.d.: standard deviation; NASH: non-alcoholic steatohepatitis; NAFLD: non-alcoholic fatty liver
disease; BMI: body mass index; ALBI: albumin-bilirubin; AFP: alpha-fetoprotein
Table 3. Comparison of pre-treatment PLR < 83 and PLR ≥ 83 groups
Pre-treatment PLR < 83 (n = 17) Pre-treatment PLR ≥ 83 (n = 25) P-value
Mean age in years (s.d.) 59.0 (9.1) 72.1 (9.6) 0.001
Males 14 (82.4%) 16 (64.0%) 0.300
Hepatitis B 2 (11.8%) 3 (12.0%) 1.000
Hepatitis C 11 (64.7%) 8 (32.0%) 0.059
Alcohol abuse 5 (29.4%) 9 (36.0%) 0.747
NASH/NAFLD 3 (17.6%) 10 (40.0%) 0.179
Mean BMI (s.d.) 26.9 (4.4) 26.5 (5.3) 0.772
Smoking history 12 (70.6%) 15 (60.0%) 0.531
Diabetes mellitus 5 (29.4%) 12 (48.0%) 0.339
Hyperlipidemia 3 (17.6%) 16 (64.0%) 0.004
Hypertension 12 (70.6%) 20 (80.0%) 0.714
ALBI grade ≥ 2 7 (41.2%) 16 (64.0%) 0.209
Child-Pugh class B 0 (0.0%) 9 (36.0%) 0.006
9
Mean platelets (10 /L) (s.d.) 97.5 (51.1) 186.2 (75.2) 0.001
Mean lymphocytes (10 /L) (s.d.) 1.67 (0.68) 1.24 (0.62) 0.048
9
Mean AFP in ng/mL (s.d.) 516 (1163) 3048 (9757) 0.211
Normal AFP 10 (58.8%) 14 (56.0%) 1.000
Mean total tumor size in cm (s.d.) 6.3 (4.0) 7.5 (4.0) 0.359
Number of tumors (s.d.) 2.06 (1.09) 1.48 (1.00) 0.090
PLR: platelet-to-lymphocyte ratio; s.d.: standard deviation; NASH: non-alcoholic steatohepatitis; NAFLD: non-alcoholic fatty liver
disease; BMI: body mass index; ALBI: albumin-bilirubin; AFP: alpha-fetoprotein
12 PR) and 23 non-responders to treatment (16 SD, 7 PD). Of the causes of progression in the 7 patients
with PD, 1 had new intrahepatic lesions, 4 had an increase in size of existing intrahepatic lesion(s) and 2
had both an increase in size of an existing intrahepatic lesion and a new intrahepatic lesion.
NLR and PLR for non-responders and responders
The mean values of NLR and PLR at pre-treatment, 2 weeks post-treatment, 3 months post-treatment and
6 months post-treatment are shown in Figure 3. The mean pre-treatment NLR for non-responders was