
Page 776 - Read Online
P. 776
Page 4 of 11 Yoneoka et al. Hepatoma Res 2020;6:67 I http://dx.doi.org/10.20517/2394-5079.2020.57
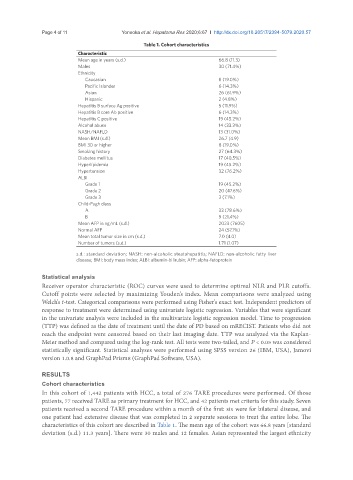
Table 1. Cohort characteristics
Characteristic
Mean age in years (s.d.) 66.8 (11.3)
Males 30 (71.4%)
Ethnicity
Caucasian 8 (19.0%)
Pacific Islander 6 (14.3%)
Asian 26 (61.9%)
Hispanic 2 (4.8%)
Hepatitis B surface Ag positive 5 (11.9%)
Hepatitis B core Ab positive 6 (14.3%)
Hepatitis C positive 19 (45.2%)
Alcohol abuse 14 (33.3%)
NASH/NAFLD 13 (31.0%)
Mean BMI (s.d.) 26.7 (4.9)
BMI 30 or higher 8 (19.0%)
Smoking history 27 (64.3%)
Diabetes mellitus 17 (40.5%)
Hyperlipidemia 19 (45.2%)
Hypertension 32 (76.2%)
ALBI
Grade 1 19 (45.2%)
Grade 2 20 (47.6%)
Grade 3 3 (7.1%)
Child-Pugh class
A 33 (78.6%)
B 9 (21.4%)
Mean AFP in ng/mL (s.d.) 2023 (7605)
Normal AFP 24 (57.1%)
Mean total tumor size in cm (s.d.) 7.0 (4.0)
Number of tumors (s.d.) 1.71 (1.07)
s.d.: standard deviation; NASH: non-alcoholic steatohepatitis; NAFLD: non-alcoholic fatty liver
disease; BMI: body mass index; ALBI: albumin-bilirubin; AFP: alpha-fetoprotein
Statistical analysis
Receiver operator characteristic (ROC) curves were used to determine optimal NLR and PLR cutoffs.
Cutoff points were selected by maximizing Youden’s index. Mean comparisons were analyzed using
Welch’s t-test. Categorical comparisons were performed using Fisher’s exact test. Independent predictors of
response to treatment were determined using univariate logistic regression. Variables that were significant
in the univariate analysis were included in the multivariate logistic regression model. Time to progression
(TTP) was defined as the date of treatment until the date of PD based on mRECIST. Patients who did not
reach the endpoint were censored based on their last imaging date. TTP was analyzed via the Kaplan-
Meier method and compared using the log-rank test. All tests were two-tailed, and P < 0.05 was considered
statistically significant. Statistical analyses were performed using SPSS version 26 (IBM, USA), Jamovi
version 1.0.8 and GraphPad Prism8 (GraphPad Software, USA).
RESULTS
Cohort characteristics
In this cohort of 1,442 patients with HCC, a total of 276 TARE procedures were performed. Of those
patients, 77 received TARE as primary treatment for HCC, and 42 patients met criteria for this study. Seven
patients received a second TARE procedure within a month of the first: six were for bilateral disease, and
one patient had extensive disease that was completed in 2 separate sessions to treat the entire lobe. The
characteristics of this cohort are described in Table 1. The mean age of the cohort was 66.8 years [standard
deviation (s.d.) 11.3 years]. There were 30 males and 12 females. Asian represented the largest ethnicity