
Page 779 - Read Online
P. 779
Yoneoka et al. Hepatoma Res 2020;6:67 I http://dx.doi.org/10.20517/2394-5079.2020.57 Page 7 of 11
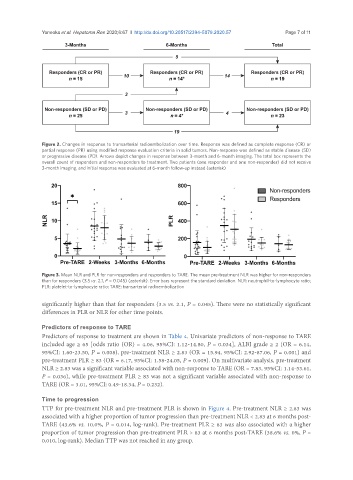
Figure 2. Changes in response to transarterial radioembolization over time. Response was defined as complete response (CR) or
partial response (PR) using modified response evaluation criteria in solid tumors. Non-response was defined as stable disease (SD)
or progressive disease (PD). Arrows depict changes in response between 3-month and 6-month imaging. The total box represents the
overall count of responders and non-responders to treatment. Two patients (one responder and one non-responder) did not receive
3-month imaging, and initial response was evaluated at 6-month follow-up instead (asterisk)
Figure 3. Mean NLR and PLR for non-responders and responders to TARE. The mean pre-treatment NLR was higher for non-responders
than for responders (3.5 vs. 2.1, P = 0.045) (asterisk). Error bars represent the standard deviation. NLR: neutrophil-to-lymphocyte ratio;
PLR: platelet-to-lymphocyte ratio; TARE: transarterial radioembolization
significantly higher than that for responders (3.5 vs. 2.1, P = 0.045). There were no statistically significant
differences in PLR or NLR for other time points.
Predictors of response to TARE
Predictors of response to treatment are shown in Table 4. Univariate predictors of non-response to TARE
included age ≥ 65 [odds ratio (OR) = 4.06, 95%CI: 1.12-14.80, P = 0.034], ALBI grade ≥ 2 (OR = 6.14,
95%CI: 1.60-23.50, P = 0.008), pre-treatment NLR ≥ 2.83 (OR = 15.94, 95%CI: 2.92-87.06, P = 0.001) and
pre-treatment PLR ≥ 83 (OR = 6.17, 95%CI: 1.58-24.05, P = 0.009). On multivariate analysis, pre-treatment
NLR ≥ 2.83 was a significant variable associated with non-response to TARE (OR = 7.83, 95%CI: 1.14-53.61,
P = 0.036), while pre-treatment PLR ≥ 83 was not a significant variable associated with non-response to
TARE (OR = 3.01, 95%CI: 0.49-18.34, P = 0.232).
Time to progression
TTP for pre-treatment NLR and pre-treatment PLR is shown in Figure 4. Pre-treatment NLR ≥ 2.83 was
associated with a higher proportion of tumor progression than pre-treatment NLR < 2.83 at 6 months post-
TARE (43.6% vs. 10.0%, P = 0.014, log-rank). Pre-treatment PLR ≥ 83 was also associated with a higher
proportion of tumor progression than pre-treatment PLR > 83 at 6 months post-TARE (38.6% vs. 0%, P =
0.010, log-rank). Median TTP was not reached in any group.