
Page 777 - Read Online
P. 777
Yoneoka et al. Hepatoma Res 2020;6:67 I http://dx.doi.org/10.20517/2394-5079.2020.57 Page 5 of 11
A B
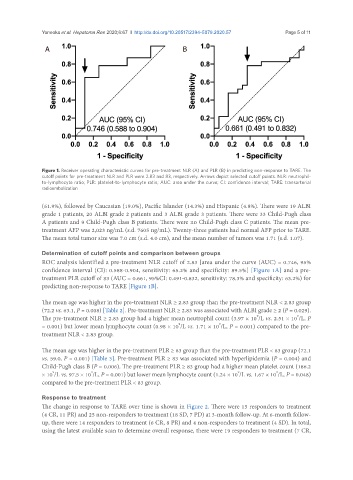
Figure 1. Receiver operating characteristic curves for pre-treatment NLR (A) and PLR (B) in predicting non-response to TARE. The
cutoff points for pre-treatment NLR and PLR were 2.83 and 83, respectively. Arrows depict selected cutoff points. NLR: neutrophil-
to-lymphocyte ratio; PLR: platelet-to-lymphocyte ratio; AUC: area under the curve; CI: confidence interval; TARE: transarterial
radioembolization
(61.9%), followed by Caucasian (19.0%), Pacific Islander (14.3%) and Hispanic (4.8%). There were 19 ALBI
grade 1 patients, 20 ALBI grade 2 patients and 3 ALBI grade 3 patients. There were 33 Child-Pugh class
A patients and 9 Child-Pugh class B patients. There were no Child-Pugh class C patients. The mean pre-
treatment AFP was 2,023 ng/mL (s.d. 7605 ng/mL). Twenty-three patients had normal AFP prior to TARE.
The mean total tumor size was 7.0 cm (s.d. 4.0 cm), and the mean number of tumors was 1.71 (s.d. 1.07).
Determination of cutoff points and comparison between groups
ROC analysis identified a pre-treatment NLR cutoff of 2.83 [area under the curve (AUC) = 0.746, 95%
confidence interval (CI): 0.588-0.904, sensitivity: 65.2% and specificity: 89.5%] [Figure 1A] and a pre-
treatment PLR cutoff of 83 (AUC = 0.661, 95%CI: 0.491-0.832, sensitivity: 78.3% and specificity: 63.2%) for
predicting non-response to TARE [Figure 1B].
The mean age was higher in the pre-treatment NLR ≥ 2.83 group than the pre-treatment NLR < 2.83 group
(72.2 vs. 63.1, P = 0.008) [Table 2]. Pre-treatment NLR ≥ 2.83 was associated with ALBI grade ≥ 2 (P = 0.029).
9
9
The pre-treatment NLR ≥ 2.83 group had a higher mean neutrophil count (3.97 × 10 /L vs. 2.51 × 10 /L, P
9
9
= 0.001) but lower mean lymphocyte count (0.98 × 10 /L vs. 1.71 × 10 /L, P = 0.001) compared to the pre-
treatment NLR < 2.83 group.
The mean age was higher in the pre-treatment PLR ≥ 83 group than the pre-treatment PLR < 83 group (72.1
vs. 59.0, P = 0.001) [Table 3]. Pre-treatment PLR ≥ 83 was associated with hyperlipidemia (P = 0.004) and
Child-Pugh class B (P = 0.006). The pre-treatment PLR ≥ 83 group had a higher mean platelet count (186.2
9
9
9
9
× 10 /L vs. 97.5 × 10 /L, P = 0.001) but lower mean lymphocyte count (1.24 × 10 /L vs. 1.67 × 10 /L, P = 0.048)
compared to the pre-treatment PLR < 83 group.
Response to treatment
The change in response to TARE over time is shown in Figure 2. There were 15 responders to treatment
(4 CR, 11 PR) and 25 non-responders to treatment (18 SD, 7 PD) at 3-month follow-up. At 6-month follow-
up, there were 14 responders to treatment (6 CR, 8 PR) and 4 non-responders to treatment (4 SD). In total,
using the latest available scan to determine overall response, there were 19 responders to treatment (7 CR,