
Page 780 - Read Online
P. 780
Page 8 of 11 Yoneoka et al. Hepatoma Res 2020;6:67 I http://dx.doi.org/10.20517/2394-5079.2020.57
Table 4. Predictors of non-response to TARE
Univariate analysis Multivariate analysis
OR (95%CI) P-value OR (95%CI) P-value
Age ≥ 65 4.06 (1.12-14.80) 0.034 1.45 (0.21-10.17) 0.709
Male sex 0.82 (0.21-3.16) 0.769
Hepatitis B 0.17 (0.02-1.68) 0.130
Hepatitis C 0.86 (0.25-2.90) 0.801
Alcohol abuse 1.80 (0.48-6.74) 0.383
NASH/NAFLD 1.49 (0.39-5.67) 0.556
BMI ≥ 30 1.48 (0.31-7.21) 0.626
Smoking history 1.09 (0.31-3.88) 0.890
Diabetes mellitus 1.32 (0.38-4.58) 0.663
Hyperlipidemia 2.82 (0.79-10.04) 0.110
Hypertension 2.19 (0.52-9.33) 0.288
ALBI grade ≥ 2 6.14 (1.60-23.50) 0.008 4.15 (0.80-21.52) 0.090
Child-Pugh class B 1.04 (0.24-4.59) 0.957
Normal AFP 0.42 (0.12-1.50) 0.183
Total tumor size ≥ 10 cm 3.00 (0.53-17.02) 0.215
Multiple tumors 0.59 (0.17-2.06) 0.410
Pre-treatment NLR ≥ 2.83 15.94 (2.92-87.06) 0.001 7.83 (1.14-53.61) 0.036
Pre-treatment PLR ≥ 83 6.17 (1.58-24.05) 0.009 3.01 (0.49-18.34) 0.232
OR: odds ratio; CI: confidence interval; NASH: non-alcoholic steatohepatitis; NAFLD: non-alcoholic fatty liver disease; BMI: body mass
index; ALBI: albumin-bilirubin; AFP: alpha-fetoprotein; NLR: neutrophil-to-lymphocyte ratio; PLR: platelet-to-lymphocyte ratio; TARE:
transarterial radioembolization
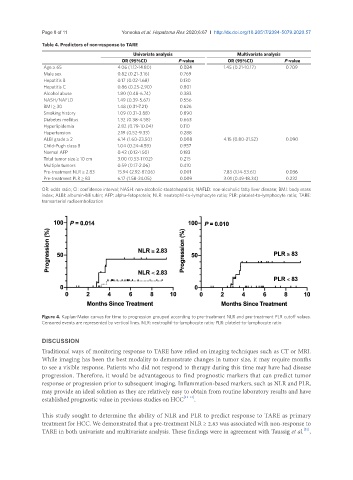
Figure 4. Kaplan-Meier curves for time to progression grouped according to pre-treatment NLR and pre-treatment PLR cutoff values.
Censored events are represented by vertical lines. NLR: neutrophil-to-lymphocyte ratio; PLR: platelet-to-lymphocyte ratio
DISCUSSION
Traditional ways of monitoring response to TARE have relied on imaging techniques such as CT or MRI.
While imaging has been the best modality to demonstrate changes in tumor size, it may require months
to see a visible response. Patients who did not respond to therapy during this time may have had disease
progression. Therefore, it would be advantageous to find prognostic markers that can predict tumor
response or progression prior to subsequent imaging. Inflammation-based markers, such as NLR and PLR,
may provide an ideal solution as they are relatively easy to obtain from routine laboratory results and have
established prognostic value in previous studies on HCC [11-14] .
This study sought to determine the ability of NLR and PLR to predict response to TARE as primary
treatment for HCC. We demonstrated that a pre-treatment NLR ≥ 2.83 was associated with non-response to
[21]
TARE in both univariate and multivariate analysis. These findings were in agreement with Taussig et al. ,