Page 596 - Read Online
P. 596

Page 4 of 13                                              Jiang et al. Hepatoma Res 2020;6:52  I  http://dx.doi.org/10.20517/2394-5079.2020.47

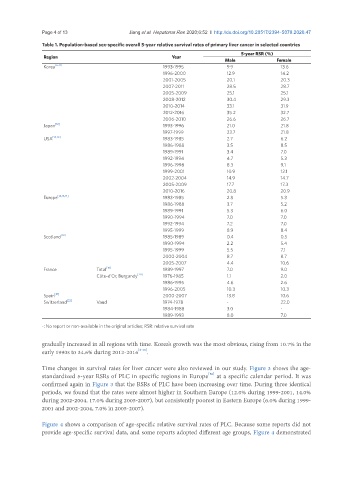
               Table 1. Population-based sex-specific overall 5-year relative survival rates of primary liver cancer in selected countries
                                                                                  5-year RSR (%)
                Region                                     Year
                                                                             Male             Female
                Korea [6-11]                            1993-1995             9.9               13.6
                                                        1996-2000             12.9              14.2
                                                        2001-2005             20.1              20.3
                                                        2007-2011             28.5              28.7
                                                        2005-2009             25.1              25.1
                                                        2008-2012             30.4              29.3
                                                        2010-2014             33.1              31.9
                                                        2012-2016             35.2              32.7
                                                        2006-2010             26.6              26.7
                Japan [12]                              1993-1996             21.0              21.8
                                                        1997-1999             23.7              21.8
                USA [14,15]                             1983-1985             2.7               6.2
                                                        1986-1988             3.5               8.5
                                                        1989-1991             3.4               7.0
                                                        1992-1994             4.7               5.3
                                                        1996-1998             8.3               9.1
                                                        1999-2001             10.9              12.1
                                                        2002-2004             14.9              14.7
                                                        2005-2009             17.7              17.3
                                                        2010-2016             20.8              20.9
                Europe [14,16,17]                       1983-1985             2.8               5.3
                                                        1986-1988             3.7               5.2
                                                        1989-1991             5.3               6.0
                                                        1990-1994             7.0               7.0
                                                        1992-1994             7.2               7.0
                                                        1995-1999             8.9               8.4
                Scotland [18]                           1985-1989             0.4               0.5
                                                        1990-1994             2.2               5.4
                                                        1995-1999             5.5               7.1
                                                        2000-2004             8.7               8.7
                                                        2005-2007             4.4               10.6
                France            Total [19]            1989-1997             7.0               9.0
                                  Côte-d’Or, Burgundy [20]  1976-1985         1.1               2.0
                                                        1986-1995             4.6               2.6
                                                        1996-2005             10.3              10.3
                Spain [21]                              2000-2007             13.8              10.6
                Switzerland [22]  Vaud                  1974-1978             -                 22.0
                                                        1984-1988             3.0               -
                                                        1989-1993             8.0               7.0
               -: No report or non-available in the original articles; RSR: relative survival rate

               gradually increased in all regions with time. Korea’s growth was the most obvious, rising from 10.7% in the
               early 1990s to 34.6% during 2012-2016 [6-11] .

               Time changes in survival rates for liver cancer were also reviewed in our study. Figure 3 shows the age-
                                                                       [36]
               standardized 5-year RSRs of PLC in specific regions in Europe  at a specific calendar period. It was
               confirmed again in Figure 3 that the RSRs of PLC have been increasing over time. During three identical
               periods, we found that the rates were almost higher in Southern Europe (12.0% during 1999-2001, 14.0%
               during 2002-2004, 17.0% during 2005-2007), but consistently poorest in Eastern Europe (6.0% during 1999-
               2001 and 2002-2004, 7.0% in 2005-2007).

               Figure 4 shows a comparison of age-specific relative survival rates of PLC. Because some reports did not
               provide age-specific survival data, and some reports adopted different age groups, Figure 4 demonstrated
   591   592   593   594   595   596   597   598   599   600   601