
Page 595 - Read Online
P. 595
Jiang et al. Hepatoma Res 2020;6:52 I http://dx.doi.org/10.20517/2394-5079.2020.47 Page 3 of 13
n
n
n
n
n
n
n
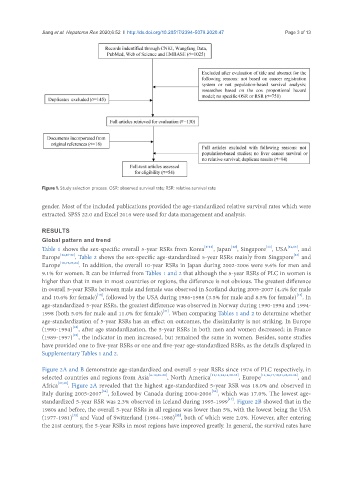
Figure 1. Study selection process. OSR: observed survival rate; RSR: relative survival rate
gender. Most of the included publications provided the age-standardized relative survival rates which were
extracted. SPSS 22.0 and Excel 2016 were used for data management and analysis.
RESULTS
Global pattern and trend
[12]
[13]
Table 1 shows the sex-specific overall 5-year RSRs from Korea [6-11] , Japan , Singapore , USA [14,15] , and
Europe [14,16-22] . Table 2 shows the sex-specific age-standardized 5-year RSRs mainly from Singapore and
[13]
Europe [16,19,23,24] . In addition, the overall 10-year RSRs in Japan during 2002-2006 were 9.6% for men and
9.1% for women. It can be inferred from Tables 1 and 2 that although the 5-year RSRs of PLC in women is
higher than that in men in most countries or regions, the difference is not obvious. The greatest difference
in overall 5-year RSRs between male and female was observed in Scotland during 2005-2007 (4.4% for male
[14]
[18]
and 10.6% for female) , followed by the USA during 1986-1988 (3.5% for male and 8.5% for female) . In
age-standardized 5-year RSRs, the greatest difference was observed in Norway during 1990-1994 and 1994-
[24]
1998 (both 5.0% for male and 11.0% for female) . When comparing Tables 1 and 2 to determine whether
age-standardization of 5-year RSRs has an effect on outcomes, the dissimilarity is not striking. In Europe
[16]
(1990-1994) , after age standardization, the 5-year RSRs in both men and women decreased; in France
(1989-1997) , the indicator in men increased, but remained the same in women. Besides, some studies
[19]
have provided one to five-year RSRs or one and five-year age-standardized RSRs, as the details displayed in
Supplementary Tables 1 and 2.
Figure 2A and B demonstrate age-standardized and overall 5-year RSRs since 1974 of PLC respectively, in
selected countries and regions from Asia [6-12,25-28] , North America [11,12,14,15,29-32] , Europe [14,16,17,19,21,22,33-36] , and
Africa [37,38] . Figure 2A revealed that the highest age-standardized 5-year RSR was 18.0% and observed in
[36]
[30]
Italy during 2005-2007 , followed by Canada during 2004-2006 , which was 17.0%. The lowest age-
standardized 5-year RSR was 2.3% observed in Iceland during 1995-1999 . Figure 2B showed that in the
[17]
1980s and before, the overall 5-year RSRs in all regions was lower than 5%, with the lowest being the USA
(1977-1981) and Vaud of Switzerland (1984-1988) , both of which were 2.0%. However, after entering
[32]
[22]
the 21st century, the 5-year RSRs in most regions have improved greatly. In general, the survival rates have