
Page 89 - Read Online
P. 89
Sarkar et al. Predictors of survival in HCC treatment
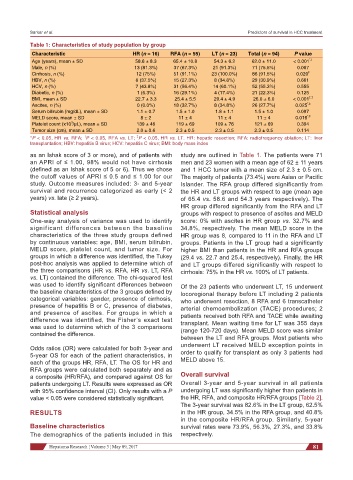
Table 1: Characteristics of study population by group
Characteristic HR (n = 16) RFA (n = 55) LT (n = 23) Total (n = 94) P value
Age (years), mean ± SD 58.6 ± 8.3 65.4 ± 10.8 54.3 ± 6.2 62.0 ± 11.0 < 0.001 *,†
Male, n (%) 13 (81.3%) 37 (67.3%) 21 (91.3%) 71 (75.5%) 0.067
Cirrhosis, n (%) 12 (75%) 51 (91.1%) 23 (100.0%) 86 (91.5%) 0.020 ‡
HBV, n (%) 6 (37.5%) 15 (27.3%) 8 (34.8%) 29 (30.9%) 0.661
HCV, n (%) 7 (43.8%) 31 (56.4%) 14 (60.1%) 52 (55.3%) 0.555
Diabetic, n (%) 1 (6.3%) 16 (29.1%) 4 (17.4%) 21 (22.3%) 0.125
BMI, mean ± SD 22.7 ± 3.3 25.4 ± 5.5 29.4 ± 4.9 26.0 ± 6.0 < 0.001 ‡,†
Ascites, n (%) 0 (0.0%) 18 (32.7%) 8 (34.8%) 26 (27.7%) 0.025 *,‡
Serum bilirubin (mg/dL), mean ± SD 1.1 ± 0.7 1.5 ± 1.0 1.8 ± 1.1 1.5 ± 1.0 0.097
MELD score, mean ± SD 8 ± 2 11 ± 4 11 ± 4 11 ± 4 0.016 *,‡
3
Platelet count (x10 /µL), mean ± SD 139 ± 46 119 ± 69 109 ± 76 121 ± 69 0.394
Tumor size (cm), mean ± SD 2.0 ± 0.6 2.3 ± 0.5 2.3 ± 0.5 2.3 ± 0.5 0.114
‡
*P < 0.05, HR vs. RFA; P < 0.05, RFA vs. LT; P < 0.05, HR vs. LT. HR: hepatic resection; RFA: radiofrequency ablation; LT: liver
†
transplantation; HBV: hepatitis B virus; HCV: hepatitis C virus; BMI: body mass index
as an Ishak score of 3 or more), and of patients with study are outlined in Table 1. The patients were 71
an APRI of ≤ 1.00, 98% would not have cirrhosis men and 23 women with a mean age of 62 ± 11 years
(defined as an Ishak score of 5 or 6). Thus we chose and 1 HCC tumor with a mean size of 2.3 ± 0.5 cm.
the cutoff values of APRI ≤ 0.5 and ≤ 1.00 for our The majority of patients (73.4%) were Asian or Pacific
study. Outcome measures included: 3- and 5-year Islander. The RFA group differed significantly from
survival and recurrence categorized as early (< 2 the HR and LT groups with respect to age (mean age
years) vs. late (≥ 2 years). of 65.4 vs. 58.6 and 54.3 years respectively). The
HR group differed significantly from the RFA and LT
Statistical analysis groups with respect to presence of ascites and MELD
One-way analysis of variance was used to identify score: 0% with ascites in HR group vs. 32.7% and
significant differences between the baseline 34.8%, respectively. The mean MELD score in the
characteristics of the three study groups defined HR group was 8, compared to 11 in the RFA and LT
by continuous variables: age, BMI, serum bilirubin, groups. Patients in the LT group had a significantly
MELD score, platelet count, and tumor size. For higher BMI than patients in the HR and RFA groups
groups in which a difference was identified, the Tukey (29.4 vs. 22.7 and 25.4, respectively). Finally, the HR
post-hoc analysis was applied to determine which of and LT groups differed significantly with respect to
the three comparisons (HR vs. RFA, HR vs. LT, RFA cirrhosis: 75% in the HR vs. 100% of LT patients.
vs. LT) contained the difference. The chi-squared test
was used to identify significant differences between Of the 23 patients who underwent LT, 15 underwent
the baseline characteristics of the 3 groups defined by locoregional therapy before LT including 2 patients
categorical variables: gender, presence of cirrhosis, who underwent resection, 8 RFA and 6 transcatheter
presence of hepatitis B or C, presence of diabetes, arterial chemoembolization (TACE) procedures; 2
and presence of ascites. For groups in which a patients received both RFA and TACE while awaiting
difference was identified, the Fisher’s exact test transplant. Mean waiting time for LT was 355 days
was used to determine which of the 3 comparisons (range 120-720 days). Mean MELD score was similar
contained the difference.
between the LT and RFA groups. Most patients who
Odds ratios (OR) were calculated for both 3-year and underwent LT received MELD exception points in
5-year OS for each of the patient characteristics, in order to qualify for transplant as only 3 patients had
each of the groups HR, RFA, LT. The OS for HR and MELD above 15.
RFA groups were calculated both separately and as
a composite (HR/RFA), and compared against OS for Overall survival
patients undergoing LT. Results were expressed as OR Overall 3-year and 5-year survival in all patients
with 95% confidence interval (CI). Only results with a P undergoing LT was significantly higher than patients in
value < 0.05 were considered statistically significant. the HR, RFA, and composite HR/RFA groups [Table 2].
The 3-year survival was 82.6% in the LT group, 62.5%
RESULTS in the HR group, 34.5% in the RFA group, and 40.8%
in the composite HR/RFA group. Similarly, 5-year
Baseline characteristics survival rates were 73.9%, 56.3%, 27.3%, and 33.8%
The demographics of the patients included in this respectively.
Hepatoma Research ¦ Volume 3 ¦ May 09, 2017 81