
Page 44 - Read Online
P. 44
Della Porta et al. Comparison of p53 and prohibitin expression
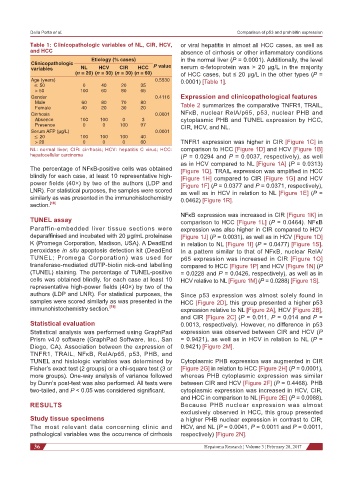
Table 1: Clinicopathologic variables of NL, CIR, HCV, or viral hepatitis in almost all HCC cases, as well as
and HCC absence of cirrhosis or other inflammatory conditions
Etiology (% cases) in the normal liver (P = 0.0001). Additionally, the level
Clinicopathologic
variables NL HCV CIR HCC P value serum α-fetoprotein was > 20 μg/L in the majority
(n = 20) (n = 30) (n = 30) (n = 60) of HCC cases, but ≤ 20 μg/L in the other types (P =
Age (years) 0.5530 0.0001) [Table 1].
≤ 50 0 40 20 35
> 50 100 60 80 65
Gender 0.4116 Expression and clinicopathological features
Male 60 80 70 80 Table 2 summarizes the comparative TNFR1, TRAIL,
Female 40 20 30 20
Cirrhosis 0.0001 NFκB, nuclear RelA/p65, p53, nuclear PHB and
Absence 100 100 0 3 cytoplasmic PHB and TUNEL expression by HCC,
Presence 0 0 100 97 CIR, HCV, and NL.
Serum AFP (μg/L) 0.0001
≤ 20 100 100 100 40
> 20 0 0 0 60 TNFR1 expression was higher in CIR [Figure 1C] in
NL: normal liver; CIR: cirrhosis; HCV: hepatitis C virus; HCC: comparison to HCC [Figure 1D] and HCV [Figure 1B]
hepatocellular carcinoma (P = 0.0294 and P = 0.0037, respectively), as well
as in HCV compared to NL [Figure 1A] (P = 0.0313)
The percentage of NFκB-positive cells was obtained [Figure 1Q]. TRAIL expression was amplified in HCC
blindly for each case, at least 10 representative high- [Figure 1H] compared to CIR [Figure 1G] and HCV
power fields (40×) by two of the authors (LDP and [Figure 1F] (P = 0.0377 and P = 0.0371, respectively),
LNR). For statistical purposes, the samples were scored as well as in HCV in relation to NL [Figure 1E] (P =
similarly as was presented in the immunohistochemistry 0.0462) [Figure 1R].
section. [18]
NFκB expression was increased in CIR [Figure 1K] in
TUNEL assay comparison to HCC [Figure 1L] (P = 0.0464). NFκB
Paraffin-embedded liver tissue sections were expression was also higher in CIR compared to HCV
deparaffinised and incubated with 20 µg/mL proteinase [Figure 1J] (P = 0.0031), as well as in HCV [Figure 1D]
K (Promega Corporation, Madison, USA). A DeadEnd in relation to NL [Figure 1I] (P = 0.0477) [Figure 1S].
peroxidase in situ apoptosis detection kit (DeadEnd In a pattern similar to that of NFκB, nuclear RelA/
TUNEL; Promega Corporation) was used for p65 expression was increased in CIR [Figure 1O]
transferase-mediated dUTP-biotin nick-end labelling compared to HCC [Figure 1P] and HCV [Figure 1N] (P
(TUNEL) staining. The percentage of TUNEL-positive = 0.0228 and P = 0.0426, respectively), as well as in
cells was obtained blindly, for each case at least 10 HCV relative to NL [Figure 1M] (P = 0.0288) [Figure 1S].
representative high-power fields (40×) by two of the
authors (LDP and LNR). For statistical purposes, the Since p53 expression was almost solely found in
samples were scored similarly as was presented in the HCC [Figure 2D], this group presented a higher p53
immunohistochemistry section. [18] expression relative to NL [Figure 2A], HCV [Figure 2B],
and CIR [Figure 2C] (P = 0.011, P = 0.014 and P =
Statistical evaluation 0.0013, respectively). However, no difference in p53
Statistical analysis was performed using GraphPad expression was observed between CIR and HCV (P
Prism v4.0 software (GraphPad Software, Inc., San = 0.9421), as well as in HCV in relation to NL (P =
Diego, CA). Association between the expression of 0.9421) [Figure 2M].
TNFR1, TRAIL, NFκB, RelA/p65, p53, PHB, and
TUNEL and histologic variables was determined by Cytoplasmic PHB expression was augmented in CIR
Fisher’s exact test (2 groups) or a chi-square test (3 or [Figure 2G] in relation to HCC [Figure 2H] (P = 0.0001),
more groups). One-way analysis of variance followed whereas PHB cytoplasmic expression was similar
by Dunn’s post-test was also performed. All tests were between CIR and HCV [Figure 2F] (P = 0.4468). PHB
two-tailed, and P < 0.05 was considered significant. cytoplasmic expression was increased in HCV, CIR,
and HCC in comparison to NL [Figure 2E] (P = 0.0088).
RESULTS Because PHB nuclear expression was almost
exclusively observed in HCC, this group presented
Study tissue specimens a higher PHB nuclear expression in contrast to CIR,
The most relevant data concerning clinic and HCV, and NL (P = 0.0041, P = 0.0011 and P = 0.0011,
pathological variables was the occurrence of cirrhosis respectively) [Figure 2N].
36 Hepatoma Research ¦ Volume 3 ¦ February 28, 2017