
Page 160 - Read Online
P. 160
Abdel-Hamid et al. Antitumor and chemosesitizing efficacy of Kochia indica on human HCC
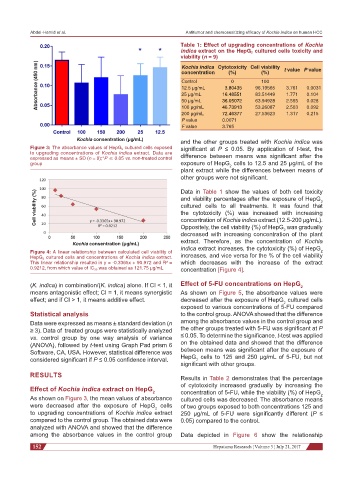
Table 1: Effect of upgrading concentrations of Kochia
indica extract on the HepG 2 cultured cells toxicity and
viability (n = 9)
Kochia indica Cytotoxicity Cell viability t value P value
concentration (%) (%)
Control 0 100
12.5 µg/mL 3.80435 96.19565 3.761 0.0031
25 µg/mL 16.48551 83.51449 1.771 0.104
50 µg/mL 36.05072 63.94928 2.555 0.028
100 µg/mL 46.73913 53.26087 2.503 0.092
200 µg/mL 72.46377 27.53623 1.317 0.215
P value 0.0071
F value 3.765
Kochia consentration (µg/mL) and the other groups treated with Kochia indica was
Figure 3: The absorbance values of HepG 2 cultured cells exposed significant at P ≤ 0.05. By application of t-test, the
to upgrading concentrations of Kochia indica extract. Data are difference between means was significant after the
expressed as means ± SD (n = 9);*P ≤ 0.05 vs. non-treated control
group exposure of HepG cells to 12.5 and 25 µg/mL of the
2
plant extract while the differences between means of
other groups were not significant.
Data in Table 1 show the values of both cell toxicity
Cell viability (%) and viability percentages after the exposure of HepG
2
cultured cells to all treatments. It was found that
the cytotoxicity (%) was increased with increasing
concentration of Kochia indica extract (12.5-200 µg/mL).
Oppositely, the cell viability (%) of HepG was gradually
2
decreased with increasing concentration of the plant
extract. Therefore, as the concentration of Kochia
Kochia consentration (µg/mL)
2
Figure 4: A linear relationship between calculated cell viability of indica extract increases, the cytotoxicity (%) of HepG
HepG 2 cultured cells and concentrations of Kochia indica extract. increases, and vice versa for the % of the cell viability
This linear relationship resulted in y = -0.3365x + 90.972 and R² = which decreases with the increase of the extract
0.9212, from which value of IC 50 was obtained as 121.75 µg/mL concentration [Figure 4].
(K. indica) in combination/(K. indica) alone. If CI < 1, it Effect of 5-FU concentrations on HepG 2
means antagonistic effect; CI = 1, it means synergistic As shown on Figure 5, the absorbance values were
effect; and if CI > 1, it means additive effect. decreased after the exposure of HepG cultured cells
2
exposed to various concentrations of 5-FU compared
Statistical analysis to the control group. ANOVA showed that the difference
Data were expressed as means ± standard deviation (n among the absorbance values in the control group and
≥ 3). Data of treated groups were statistically analyzed the other groups treated with 5-FU was significant at P
vs. control group by one way analysis of variance ≤ 0.05. To determine the significance, t-test was applied
(ANOVA), followed by t-test using Graph Pad prism 6 on the obtained data and showed that the difference
Software, CA, USA. However, statistical difference was between means was significant after the exposure of
considered significant if P ≤ 0.05 confidence interval. HepG cells to 125 and 250 µg/mL of 5-FU, but not
2
significant with other groups.
RESULTS Results in Table 2 demonstrates that the percentage
of cytotoxicity increased gradually by increasing the
Effect of Kochia indica extract on HepG 2 concentration of 5-FU, while the viability (%) of HepG
2
As shown on Figure 3, the mean values of absorbance cultured cells was decreased. The absorbance means
were decreased after the exposure of HepG cells of two groups exposed to both concentrations 125 and
2
to upgrading concentrations of Kochia indica extract 250 µg/mL of 5-FU were significantly different (P ≤
compared to the control group. The obtained data were 0.05) compared to the control.
analyzed with ANOVA and showed that the difference
among the absorbance values in the control group Data depicted in Figure 6 show the relationship
152 Hepatoma Research ¦ Volume 3 ¦ July 21, 2017