
Page 78 - Read Online
P. 78
a b
a b
c d
c d
e f
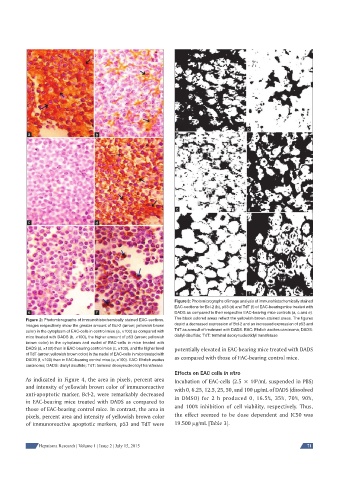
Figure 3: Photomicrographs of image analysis of immunohistochemically stained
EAC-sections for Bcl-2 (b), p53 (d) and TdT (f) of EAC-bearing mice treated with
e f DADS as compared to their respective EAC-bearing mice controls (a, c and e).
Figure 2: Photomicrographs of immunohistochemically stained EAC-sections. The black colored areas refl ect the yellowish brown stained areas. The fi gures
Images respectively show the greater amount of Bcl-2 (arrow; yellowish brown depict a decreased expression of Bcl-2 and an increased expression of p53 and
color) in the cytoplasm of EAC-cells in control mice (a, ×100) as compared with TdT as a result of treatment with DADS. EAC: Ehrlich ascites carcinoma; DADS:
mice treated with DADS (b, ×100), the higher amount of p53 (arrow; yellowish diallyl disulfi de; TdT: terminal deoxynucleotidyl transferase
brown color) in the cytoplasm and nuclei of EAC-cells in mice treated with
DADS (d, ×100) than in EAC-bearing control mice (c, ×100), and the higher level potentially elevated in EAC-bearing mice treated with DADS
of TdT (arrow; yellowish brown color) in the nuclei of EAC-cells in mice treated with
DADS (f, ×100) than in EAC-bearing control mice (e, ×100). EAC: Ehrlich ascites as compared with those of EAC-bearing control mice.
carcinoma; DADS: diallyl disulfi de; TdT: terminal deoxynucleotidyl transferase
Effects on EAC cells in vitro
As indicated in Figure 4, the area in pixels, percent area Incubation of EAC-cells (2.5 × 10 /mL suspended in PBS)
5
and intensity of yellowish brown color of immunoreactive with 0, 6.25, 12.5, 25, 50, and 100 μg/mL of DADS (dissolved
anti-apoptotic marker, Bcl-2, were remarkably decreased
in EAC-bearing mice treated with DADS as compared to in DMSO) for 2 h produced 0, 16.5%, 35%, 70%, 90%,
those of EAC-bearing control mice. In contrast, the area in and 100% inhibition of cell viability, respectively. Thus,
pixels, percent area and intensity of yellowish brown color the effect seemed to be dose dependent and IC50 was
of immunoreactive apoptotic markers, p53 and TdT were 19.500 μg/mL [Table 3].
Hepatoma Research | Volume 1 | Issue 2 | July 15, 2015 71