
Page 77 - Read Online
P. 77
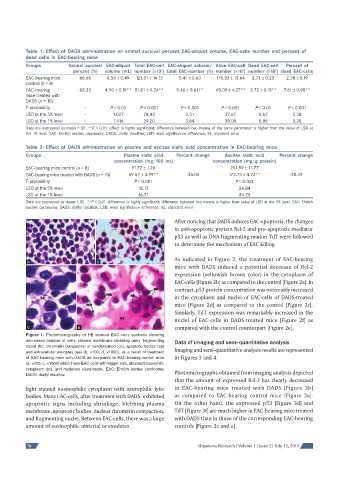
Table 1: Effect of DADS administration on animal survival percent EAC-aliquot volume, EAC-cells number and percent of
          dead cells in EAC-bearing mice
          Groups         Animal survival  EAC-aliquot  Total EAC-cell  EAC-aliquot volume/ Alive EAC-cell  Dead EAC-cell   Percent of
                                                                                                  7
                                                                                      7
                                                          7
                           percent (%)  volume (mL) number (×10 ) total EAC-number (%) number (×10 ) number (×10 ) dead EAC-cells
          EAC-bearing mice   66.66     6.56 ± 0.49  121.31 ± 14.13  5.41 ± 0.63  118.33 ± 13.64  2.71 ± 0.23  2.38 ± 0.19
          control (n = 8)
          EAC-bearing        83.33    4.90 ± 0.19** 51.81 ± 4.24**  9.46 ± 0.61**  48.09 ± 4.27**  3.72 ± 0.19**  7.61 ± 0.98**
          mice treated with
          DADS (n = 10)
          F-probability        -        P < 0.01  P < 0.001      P < 0.001     P < 0.001   P < 0.01   P < 0.001
          LSD at the 5% level  -         1.027     28.45          2.51          27.62       0.63        2.38
          LSD at the 1% level  -         1.416     39.20          3.64          38.05       0.86        3.28
          Data are expressed as mean ± SE. **P < 0.01: effect is highly signifi cant; difference between two means of the same parameter is higher than the value of LSD at
          the 1% level. EAC: Ehrlich ascites carcinoma; DADS: diallyl disulfi de; LSD: least signifi cance difference; SE: standard error

          Table 2: Effect of DADS administration on plasma and ascites sialic acid concentration in EAC-bearing mice
          Groups                             Plasma sialic acid   Percent change  Ascites sialic acid   Percent change
                                         concentration (mg/100 mL)          concentration (mg/g protein)
          EAC-bearing mice control (n = 8)     91.72 ± 1.26                       241.59 ± 11.77
          EAC-bearing mice treated with DADS (n = 10)  59.57 ± 4.99**  -35.05    172.74 ± 4.72**       -28.49
          F-probability                         P < 0.001                           P < 0.001
          LSD at the 5% level                     12.13                              24.84
          LSD at the 1% level                    16.71                               34.23
          Data are expressed as mean ± SE. **P < 0.01: difference is highly signifi cant; difference between two means is higher than value of LSD at the 5% level. EAC: Ehrlich
          ascites carcinoma; DADS: diallyl disulfi de; LSD: least signifi cance difference; SE: standard error

                                                              After noticing that DADS induces EAC-apoptosis, the changes
                                                              in anti-apoptotic protein Bcl-2 and pro-apoptotic mediator
                                                              p53 as well as DNA fragmenting marker TdT were followed
                                                              to determine the mechanism of EAC killing.

                                                              As indicated in Figure 2, the treatment of EAC-bearing
           a                       b
                                                              mice with DADS induced a potential decrease of Bcl-2
                                                              expression (yellowish brown color) in the cytoplasm of
                                                              EAC-cells [Figure 2b] as compared to the control [Figure 2a]. In
                                                              contrast, p53 protein concentration was noticeably increased
                                                              in the cytoplasm and nuclei of EAC-cells of DADS-treated
                                                              mice [Figure 2d] as compared to the control [Figure 2c].
                                                              Similarly, TdT expression was remarkably increased in the
                                                              nuclei of EAC-cells in DADS-treated mice [Figure 2f] as
           c                d                                 compared with the control counterpart [Figure 2e].
          Figure  1: Photomicrographs of HE stained EAC-cells sections showing
          decreased number of cells, plasma membrane blebbing (mb), fragmenting   Data of imaging and semi-quantitative analysis
          nuclei (fn), chromatin compaction or condensation (cc), apoptotic bodies (ap)   Imaging and semi-quantitative analysis results are represented
          and extracellular exudates (ee) (b, ×100; d, ×1000), as a result of treatment
          of EAC-bearing mice with DADS as compared to EAC-bearing control mice   in Figures 3 and 4.
          (a, ×100; c, ×1000) which have EAC-cells with bigger size, abundant basophilic
          cytoplasm (bc), and moderate sized-nuclei. EAC: Ehrlich ascites carcinoma;   Photomicrographs obtained from imaging analysis depicted
          DADS: diallyl disulfi de
                                                              that the amount of expressed Bcl-2 has clearly decreased
          light stained eosinophilic cytoplasm with azurophilic lytic   in EAC-bearing mice treated with DADS [Figure 3b]
          bodies. Many EAC-cells, after treatment with DADS, exhibited   as compared to EAC-bearing control mice [Figure 3a].
          apoptotic signs including shrinkage, blebbing plasma   On the other hand, the expressed p53 [Figure 3d] and
          membrane, apoptotic bodies, nuclear chromatin compaction,   TdT [Figure 3f] are much higher in EAC-bearing mice treated
          and fragmenting nuclei. Between EAC-cells, there was a large   with DADS than in those of the corresponding EAC-bearing
          amount of eosinophilic material or exudates.        controls [Figure 3c and e].


          70                                                           Hepatoma Research | Volume 1 | Issue 2 | July 15, 2015