
Page 123 - Read Online
P. 123
Page 10 of 14 Santillan Hepatoma Res 2020;6:63 I http://dx.doi.org/10.20517/2394-5079.2020.60
A B
C D
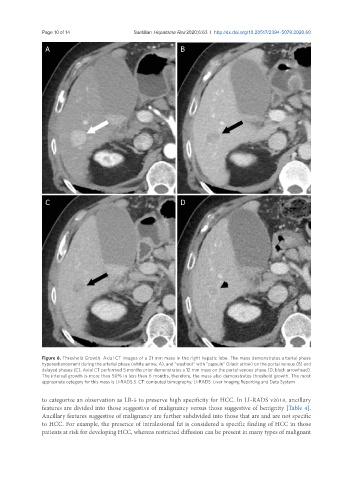
Figure 6. Threshold Growth. Axial CT images of a 21 mm mass in the right hepatic lobe. The mass demonstrates arterial phase
hyperenhancement during the arterial phase (white arrow, A), and “washout” with “capsule” (black arrow) on the portal venous (B) and
delayed phases (C). Axial CT performed 5 months prior demonstrates a 12 mm mass on the portal venous phase (D, black arrowhead).
The interval growth is more than 50% in less than 6 months, therefore, the mass also demonstrates threshold growth. The most
appropriate category for this mass is LI-RADS 5. CT: computed tomography; LI-RADS: Liver Imaging Reporting and Data System
to categorize an observation as LR-5 to preserve high specificity for HCC. In LI-RADS v2018, ancillary
features are divided into those suggestive of malignancy versus those suggestive of benignity [Table 4].
Ancillary features suggestive of malignancy are further subdivided into those that are and are not specific
to HCC. For example, the presence of intralesional fat is considered a specific finding of HCC in those
patients at risk for developing HCC, whereas restricted diffusion can be present in many types of malignant