


Page 16 - Read Online
P. 16
Page 6 of 12                          Yu et al. Hepatoma Res. 2025;11:29 | https://dx.doi.org/10.20517/2394-5079.2025.47

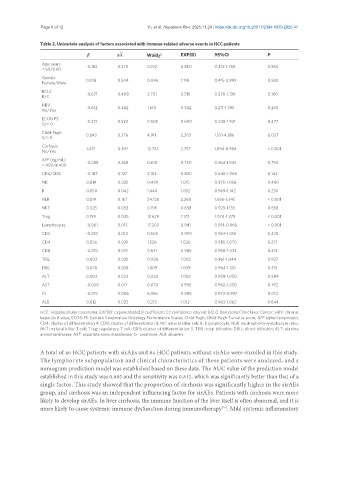
               Table 2. Univariate analysis of factors associated with immune-related adverse events in HCC patients
                                β         sX         Waldχ 2     EXP(B)     95%CI              P

                Age, years     -0.162     0.370      0.192       0.850      0.412-1.755        0.850
                < 60/≥ 60
                Gender         0.108      0.504      0.046       1.114      0.415-2.993        0.830
                Female/Male
                BCLC           -0.671     0.408      2.701       0.511      0.230-1.138        0.100
                B/C
                HBV            -0.612     0.482      1.610       0.542      0.211-1.395        0.205
                No/Yes
                ECOG PS        -0.371     0.522      0.505       0.690      0.248-1.921        0.477
                0/> 0
                Child-Pugh     0.843      0.376      4.911       2.303      1.101-4.816        0.027
                5/> 5
                Cirrhosis      1.417      0.397      12.733      2.757      1.894-8.984        < 0.001
                No/Yes
                AFP (ng/mL)    -0.288     0.368      0.610       0.750      0.364-1.543        0.750
                < 400/≥ 400
                CD4/CD8        -0.187     0.127      2.152       0.830      0.646-1.065        0.142
                NK             0.014      0.021      0.499       1.015      0.975-1.056        0.480
                B              0.050      0.042      1.444       1.052      0.969-1.142        0.230
                NLR            0.819      0.167      24.126      2.268      1.636-3.145        < 0.001
                NKT            0.023      0.053      0.196       0.658      0.923-1.135        0.658
                Treg           0.159      0.045      12.629      1.172      1.074-1.279        < 0.001
                Lymphocytes    -0.061     0.015      17.203      0.941      0.914-0.968        < 0.001
                CD3            -0.010     0.014      0.503       0.990      0.963-1.018        0.478
                CD4            0.026      0.021      1.526       1.026      0.985-1.070        0.217
                CD8            -0.015     0.019      0.671       0.985      0.950-1.021        0.413
                TBIL           0.002      0.021      0.006       1.002      0.961-1.044        0.937
                DBIL           0.038      0.038      1.009       1.039      0.964-1.120        0.315
                ALT            0.003      0.023      0.020       1.003      0.959-1.050        0.889
                AST            -0.005     0.017      0.070       0.995      0.962-1.030        0.792
                Cr             -0.015     0.006      6.055       0.985      0.973-0.997        0.014
                ALB            0.012      0.025      0.213       1.012      0.963-1.062        0.644
               HCC: Hepatocellular carcinoma; EXP(B): exponentiated B coefficient; CI: confidence interval; BCLC: Barcelona Clinic Liver Cancer; HBV: chronic
               hepatitis B virus; ECOG PS: Eastern Cooperative Oncology Performance Status; Child-Pugh: Child-Pugh-Turcotte score; AFP alpha-fetoprotein;
               CD4: cluster of differentiation 4; CD8: cluster of differentiation 8; NK: natural killer cell; B: B lymphocyte; NLR: neutrophil-to-lymphocyte ratio;
               NKT: natural killer T cell; Treg: regulatory T cell; CD3: cluster of differentiation 3; TBIL: total bilirubin; DBIL: direct bilirubin; ALT: alanine
               aminotransferase; AST: aspartate aminotransferase; Cr: creatinine; ALB: albumin.

               A total of 46 HCC patients with sirAEs and 84 HCC patients without sirAEs were enrolled in this study.
               The lymphocyte subpopulation and clinical characteristics of these patients were analyzed, and a
               nomogram prediction model was established based on these data. The AUC value of the prediction model
               established in this study was 0.885 and the sensitivity was 0.812, which was significantly better than that of a
               single factor. This study showed that the proportion of cirrhosis was significantly higher in the sirAEs
               group, and cirrhosis was an independent influencing factor for sirAEs. Patients with cirrhosis were more
               likely to develop sirAEs. In liver cirrhosis, the immune function of the liver itself is often abnormal, and it is
               more likely to cause systemic immune dysfunction during immunotherapy . Mild systemic inflammatory
                                                                               [10]

