


Page 19 - Read Online
P. 19
Yu et al. Hepatoma Res. 2025;11:29 | https://dx.doi.org/10.20517/2394-5079.2025.47  Page 9 of 12


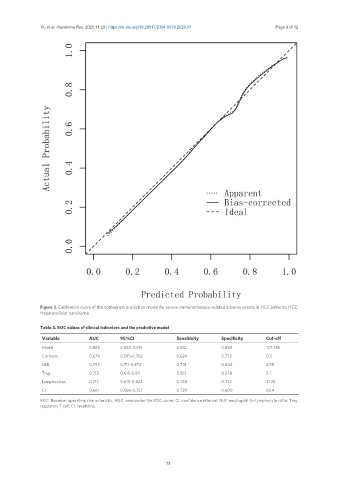
               Figure 3. Calibration curve of the nomogram prediction model for severe immunotherapy-related adverse events in HCC patients. HCC:
               Hepatocellular carcinoma.

               Table 4. ROC values of clinical indicators and the predictive model

                Variable        AUC        95%CI               Sensitivity     Specificity     Cut-off
                Model           0.885      0.820-0.951         0.812           0.889           137.786
                Cirrhosis       0.678      0.595-0.762         0.624           0.733           0.5
                NLR             0.793      0.711-0.874         0.718           0.844           2.55
                Treg            0.713      0.615-0.811         0.812           0.578           5.1
                Lymphocytes     0.717      0.610-0.824         0.788           0.733           31.75
                Cr              0.661      0.566-0.757         0.729           0.600           56.4
               ROC: Receiver operating characteristic; AUC: area under the ROC curve; CI: confidence interval; NLR: neutrophil-to-lymphocyte ratio; Treg:
               regulatory T cell; Cr: creatinine.

