
Page 225 - Read Online
P. 225
Kautsar et al. Energy Mater. 2025, 5, 500129 https://dx.doi.org/10.20517/energymater.2025.26 Page 9 of 14
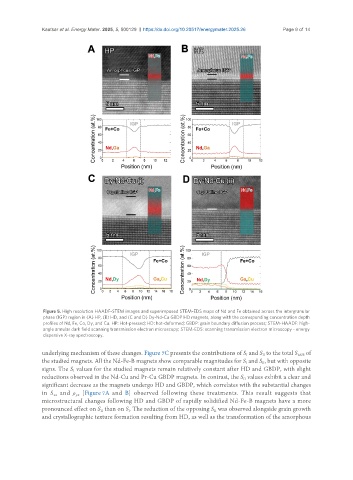
Figure 5. High resolution HAADF-STEM images and superimposed STEM-EDS maps of Nd and Fe obtained across the intergranular
phase (IGP) region in (A) HP, (B) HD, and (C and D) Dy-Nd-Cu GBDP HD magnets, along with the corresponding concentration depth
profiles of Nd, Fe, Co, Dy, and Cu. HP: Hot-pressed; HD: hot-deformed; GBDP: grain boundary diffusion process; STEM-HAADF: high-
angle annular dark field scanning transmission electron microscopy; STEM-EDS: scanning transmission electron microscopy - energy
dispersive X-ray spectroscopy.
underlying mechanism of these changes. Figure 7C presents the contributions of S and S to the total S of
II
I
ANE
the studied magnets. All the Nd-Fe-B magnets show comparable magnitudes for S and S , but with opposite
I
II
signs. The S values for the studied magnets remain relatively constant after HD and GBDP, with slight
I
reductions observed in the Nd-Cu and Pr-Cu GBDP magnets. In contrast, the S values exhibit a clear and
II
significant decrease as the magnets undergo HD and GBDP, which correlates with the substantial changes
in S and ρ [Figure 7A and B] observed following these treatments. This result suggests that
yx
xx
microstructural changes following HD and GBDP of rapidly solidified Nd-Fe-B magnets have a more
pronounced effect on S than on S . The reduction of the opposing S was observed alongside grain growth
I
II
II
and crystallographic texture formation resulting from HD, as well as the transformation of the amorphous