Page 196 - Read Online
P. 196

Seo et al. Energy Mater. 2025, 5, 500123  https://dx.doi.org/10.20517/energymater.2025.38  Page 13 of 18


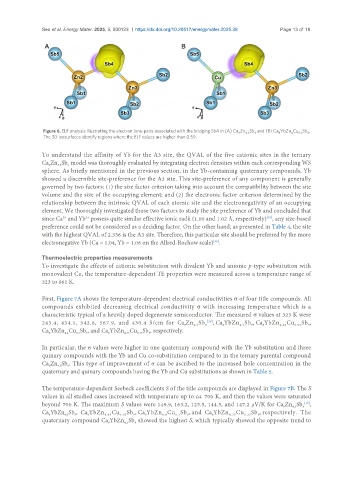
                Figure 6. ELF analysis illustrating the electron lone-pairs associated with the bridging Sb4 in (A) Ca Zn Sb  and (B) Ca YbZn Cu Sb .
                                                                                               8
                                                                                       9
                                                                                                         9
                                                                                                   4
                                                                                                      0.5
                                                                                    4.5
                                                                                 9
                The 3D isosurfaces identify regions where the ELF values are higher than 0.59.
               To understand the affinity of Yb for the A3 site, the QVAL of the five cationic sites in the ternary
               Ca Zn Sb  model was thoroughly evaluated by integrating electron densities within each corresponding WS
                 9
                    4.5
                        9
               sphere. As briefly mentioned in the previous section, in the Yb-containing quaternary compounds, Yb
               showed a discernible site-preference for the A3 site. This site-preference of any component is generally
               governed by two factors: (1) the size factor criterion taking into account the compatibility between the site
               volume and the size of the occupying element; and (2) the electronic factor criterion determined by the
               relationship between the intrinsic QVAL of each atomic site and the electronegativity of an occupying
               element. We thoroughly investigated those two factors to study the site preference of Yb and concluded that
                                                                                           [35]
                              2+
               since Ca  and Yb  possess quite similar effective ionic radii (1.00 and 1.02 Å, respectively) , any size-based
                      2+
               preference could not be considered as a deciding factor. On the other hand, as presented in Table 4, the site
               with the highest QVAL of 2.336 is the A3 site. Therefore, this particular site should be preferred by the more
                                                                         [36]
               electronegative Yb (Ca = 1.04, Yb = 1.06 on the Allred-Rochow scale) .
               Thermoelectric properties measurements
               To investigate the effects of cationic substitution with divalent Yb and anionic p-type substitution with
               monovalent Cu, the temperature-dependent TE properties were measured across a temperature range of
               323 to 861 K.


               First, Figure 7A shows the temperature-dependent electrical conductivities σ of four title compounds. All
               compounds exhibited decreasing electrical conductivity σ with increasing temperature which is a
               characteristic typical of a heavily doped degenerate semiconductor. The measured σ values at 323 K were
               243.4,  434.1,  542.8,  567.9,  and  430.4  S/cm  for  Ca Zn Sb 9 [19] , Ca YbZn Sb , Ca YbZn Cu Sb ,
                                                                                               4.45
                                                                                                    0.05
                                                               9
                                                                                          8
                                                                                                         9
                                                                            8
                                                                                  4.5
                                                                                      9
                                                                  4.5
               Ca YbZn Cu Sb , and Ca YbZn Cu Sb , respectively.
                                                   9
                                               0.15
                                           4.35
                                     8
                              9
                           0.1
                       4.4
                 8
               In particular, the σ values were higher in one quaternary compound with the Yb substitution and three
               quinary compounds with the Yb and Cu co-substitution compared to in the ternary parental compound
               Ca Zn Sb . This type of improvement of σ can be ascribed to the increased hole concentration in the
                        9
                    4.5
                 9
               quaternary and quinary compounds having the Yb and Cu substitutions as shown in Table 5.
               The temperature-dependent Seebeck coefficients S of the title compounds are displayed in Figure 7B. The S
               values in all studied cases increased with temperature up to ca. 700 K, and then the values were saturated
               beyond 700 K. The maximum S values were 149.9, 163.2, 125.5, 144.5, and 147.2 μV/K for Ca Zn Sb ,
                                                                                                        [19]
                                                                                                    4.5
                                                                                                       9
                                                                                                 9
               Ca YbZn Sb ,  Ca YbZn Cu Sb , Ca YbZn Cu Sb , and  Ca YbZn Cu Sb , respectively.  The
                                                                                        9
                                                                                   0.15
                                         0.05
                 8
                                              9
                              8
                                    4.45
                       4.5
                          9
                                                                9
                                                                        8
                                                                              4.35
                                                  8
                                                        4.4
                                                            0.1
               quaternary compound Ca YbZn Sb  showed the highest S, which typically showed the opposite trend to
                                              9
                                           4.5
                                     8
   191   192   193   194   195   196   197   198   199   200   201