
Page 195 - Read Online
P. 195
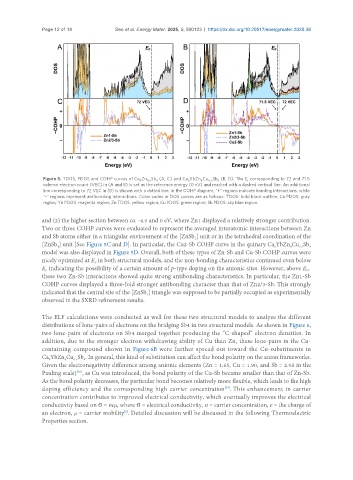
Page 12 of 18            Seo et al. Energy Mater. 2025, 5, 500123  https://dx.doi.org/10.20517/energymater.2025.38


                Figure 5. TDOS, PDOS and COHP curves of Ca Zn Sb  (A, C) and Ca YbZn Cu Sb  (B, D). The E  corresponding to 72 and 71.5
                                                9  4.5  9       8    4  0.5  9      F
                valence electron count (VEC) in (A and B) is set as the reference energy (0 eV) and marked with a dashed vertical line. An additional
                line corresponding to 72 VEC in (B) is shown with a dotted line. In the COHP diagram, "+" regions indicate bonding interactions, while
                "-" regions represent antibonding interactions. Color codes in DOS curves are as follows: TDOS: bold black outline; Ca PDOS: gray
                region; Yb PDOS: magenta region; Zn TDOS: yellow region; Cu PDOS: green region; Sb PDOS: sky blue region.


               and (2) the higher section between ca. -4.5 and 0 eV, where Zn1 displayed a relatively stronger contribution.
               Two or three COHP curves were evaluated to represent the averaged interatomic interactions between Zn
               and Sb atoms either in a triangular environment of the [ZnSb ] unit or in the tetrahedral coordination of the
                                                                   3
               [ZnSb ] unit [See Figure 5C and D]. In particular, the Cu2-Sb COHP curve in the quinary Ca YbZn Cu Sb
                                                                                                         9
                                                                                             8
                                                                                                   4
                                                                                                      0.5
                    4
               model was also displayed in Figure 5D. Overall, both of these types of Zn-Sb and Cu-Sb COHP curves were
               nicely optimized at E  in both structural models, and the non-bonding characteristics continued even below
                                 F
               E  indicating the possibility of a certain amount of p-type doping on the anionic sites. However, above E ,
                F
                                                                                                        F
               these two Zn-Sb interactions showed quite strong antibonding characteristics. In particular, the Zn1-Sb
               COHP curves displayed a three-fold stronger antibonding character than that of Zn2/3-Sb. This strongly
               indicated that the central site of the [ZnSb ] triangle was supposed to be partially occupied as experimentally
                                                  3
               observed in the SXRD refinement results.
               The ELF calculations were conducted as well for these two structural models to analyze the different
               distributions of lone-pairs of electrons on the bridging Sb4 in two structural models. As shown in Figure 6,
               two lone-pairs of electrons on Sb4 merged together producing the “C-shaped” electron densities. In
               addition, due to the stronger electron withdrawing ability of Cu than Zn, these lone-pairs in the Cu-
               containing compound shown in Figure 6B were further spread out toward the Cu-substituents in
               Ca YbZn Cu Sb . In general, this kind of substitution can affect the bond polarity on the anion frameworks.
                             9
                          0.5
                 8
                       4
               Given the electronegativity difference among anionic elements (Zn = 1.65, Cu = 1.90, and Sb = 2.05 in the
               Pauling scale) , as Cu was introduced, the bond polarity of the Cu-Sb became smaller than that of Zn-Sb.
                           [36]
               As the bond polarity decreases, the particular bond becomes relatively more flexible, which leads to the high
               doping efficiency and the corresponding high carrier concentration . This enhancement in carrier
                                                                             [37]
               concentration contributes to improved electrical conductivity, which eventually improves the electrical
               conductivity based on σ = neμ, where σ = electrical conductivity, n = carrier concentration, e = the charge of
               an electron, μ = carrier mobility . Detailed discussion will be discussed in the following Thermoelectric
                                           [6]
               Properties section.