
Page 123 - Read Online
P. 123
Ahmed et al. Energy Mater. 2025, 5, 500079 https://dx.doi.org/10.20517/energymater.2024.209 Page 9 of 13
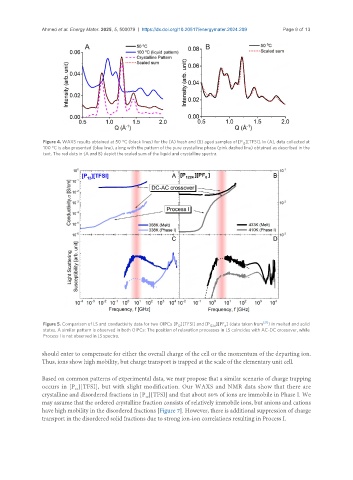
Figure 4. WAXS results obtained at 50 °C (black lines) for the (A) fresh and (B) aged samples of [P ][TFSI]. In (A), data collected at
12
100 °C is also presented (blue line), along with the pattern of the pure crystalline phase (pink dashed line) obtained as described in the
text. The red dots in (A and B) depict the scaled sum of the liquid and crystalline spectra.
Figure 5. Comparison of LS and conductivity data for two OIPCs [P ][TFSI] and [P 1224 ][PF ] (data taken from [21] ) in melted and solid
12
6
states. A similar pattern is observed in both OIPCs: The position of relaxation processes in LS coincides with AC-DC crossover, while
Process I is not observed in LS spectra.
should enter to compensate for either the overall charge of the cell or the momentum of the departing ion.
Thus, ions show high mobility, but charge transport is trapped at the scale of the elementary unit cell.
Based on common patterns of experimental data, we may propose that a similar scenario of charge trapping
occurs in [P ][TFSI], but with slight modification. Our WAXS and NMR data show that there are
12
crystalline and disordered fractions in [P ][TFSI] and that about 80% of ions are immobile in Phase I. We
12
may assume that the ordered crystalline fraction consists of relatively immobile ions, but anions and cations
have high mobility in the disordered fractions [Figure 7]. However, there is additional suppression of charge
transport in the disordered solid fractions due to strong ion-ion correlations resulting in Process I.