
Page 120 - Read Online
P. 120
Page 6 of 13 Ahmed et al. Energy Mater. 2025, 5, 500079 https://dx.doi.org/10.20517/energymater.2024.209
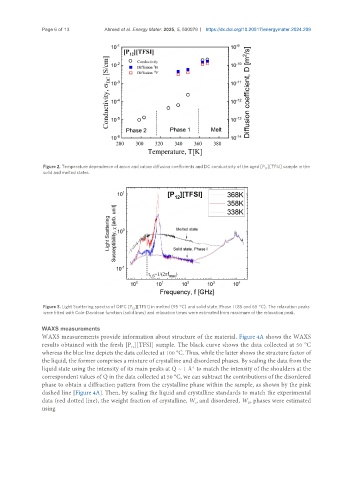
Figure 2. Temperature dependence of anion and cation diffusion coefficients and DC conductivity of the aged [P ][TFSI] sample in the
12
solid and melted states.
Figure 3. Light Scattering spectra of OIPC [P ][TFSI] in melted (95 °C) and solid state, Phase I (85 and 65 °C). The relaxation peaks
12
were fitted with Cole-Davidson function (solid lines) and relaxation times were estimated from maximum of the relaxation peak.
WAXS measurements
WAXS measurements provide information about structure of the material. Figure 4A shows the WAXS
results obtained with the fresh [P ][TFSI] sample. The black curve shows the data collected at 50 °C
12
whereas the blue line depicts the data collected at 100 °C. Thus, while the latter shows the structure factor of
the liquid, the former comprises a mixture of crystalline and disordered phases. By scaling the data from the
liquid state using the intensity of its main peaks at Q ~ 1 Å to match the intensity of the shoulders at the
-1
correspondent values of Q in the data collected at 50 °C, we can subtract the contributions of the disordered
phase to obtain a diffraction pattern from the crystalline phase within the sample, as shown by the pink
dashed line [Figure 4A]. Then, by scaling the liquid and crystalline standards to match the experimental
data (red dotted line), the weight fraction of crystalline, W , and disordered, W , phases were estimated
D
c
using