
Page 118 - Read Online
P. 118
Page 4 of 13 Ahmed et al. Energy Mater. 2025, 5, 500079 https://dx.doi.org/10.20517/energymater.2024.209
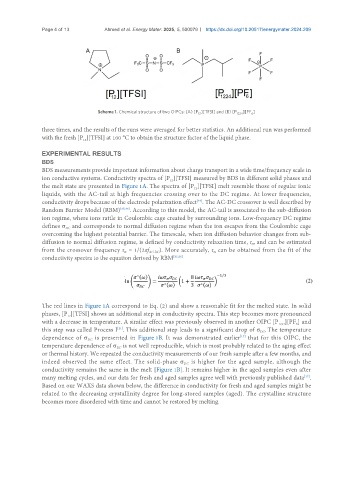
Scheme 1. Chemical structure of two OIPCs: (A) [P ][TFSI] and (B) [P 1224 ][PF ]
6
12
three times, and the results of the runs were averaged for better statistics. An additional run was performed
with the fresh [P ][TFSI] at 100 °C to obtain the structure factor of the liquid phase.
12
EXPERIMENTAL RESULTS
BDS
BDS measurements provide important information about charge transport in a wide time/frequency scale in
ion conductive systems. Conductivity spectra of [P ][TFSI] measured by BDS in different solid phases and
12
the melt state are presented in Figure 1A. The spectra of [P ][TFSI] melt resemble those of regular ionic
12
liquids, with the AC-tail at high frequencies crossing over to the DC regime. At lower frequencies,
conductivity drops because of the electrode polarization effect . The AC-DC crossover is well described by
[34]
Random Barrier Model (RBM) [35,36] . According to this model, the AC-tail is associated to the sub-diffusion
ion regime, where ions rattle in Coulombic cage created by surrounding ions. Low-frequency DC regime
defines σ and corresponds to normal diffusion regime when the ion escapes from the Coulombic cage
DC
overcoming the highest potential barrier. The timescale, when ion diffusion behavior changes from sub-
diffusion to normal diffusion regime, is defined by conductivity relaxation time, τ , and can be estimated
σ
from the crossover frequency τ = 1/(2πf AC-DC ). More accurately, τ can be obtained from the fit of the
σ
σ
conductivity spectra to the equation derived by RBM [35,36]
The red lines in Figure 1A correspond to Eq. (2) and show a reasonable fit for the melted state. In solid
phases, [P ][TFSI] shows an additional step in conductivity spectra. This step becomes more pronounced
12
with a decrease in temperature. A similar effect was previously observed in another OIPC [P ][PF ] and
6
1224
this step was called Process I . This additional step leads to a significant drop of σ . The temperature
[21]
DC
dependence of σ is presented in Figure 1B. It was demonstrated earlier that for this OIPC, the
[17]
DC
temperature dependence of σ is not well reproducible, which is most probably related to the aging effect
DC
or thermal history. We repeated the conductivity measurements of our fresh sample after a few months, and
indeed observed the same effect. The solid-phase σ is higher for the aged sample, although the
DC
conductivity remains the same in the melt [Figure 1B]. It remains higher in the aged samples even after
many melting cycles, and our data for fresh and aged samples agree well with previously published data .
[17]
Based on our WAXS data shown below, the difference in conductivity for fresh and aged samples might be
related to the decreasing crystallinity degree for long-stored samples (aged). The crystalline structure
becomes more disordered with time and cannot be restored by melting.