
Page 119 - Read Online
P. 119
Ahmed et al. Energy Mater. 2025, 5, 500079 https://dx.doi.org/10.20517/energymater.2024.209 Page 5 of 13
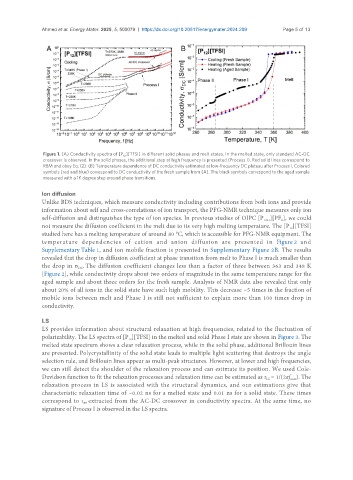
Figure 1. (A) Conductivity spectra of [P ][TFSI] in different solid phases and melt states. In the melted state, only standard AC-DC
12
crossover is observed. In the solid phases, the additional step at high frequency is presented (Process I). Red solid lines correspond to
RBM and obey Eq. (2). (B) Temperature dependence of DC conductivity estimated at low-frequency DC plateau after Process I. Colored
symbols (red and blue) correspond to DC conductivity of the fresh sample from (A). The black symbols correspond to the aged sample
measured with a 1K degree step around phase transitions.
Ion diffusion
Unlike BDS techniques, which measure conductivity including contributions from both ions and provide
information about self and cross-correlations of ion transport, the PFG-NMR technique measures only ion
self-diffusion and distinguishes the type of ion species. In previous studies of OIPC [P ][PF ], we could
1224
6
not measure the diffusion coefficient in the melt due to its very high melting temperature. The [P ][TFSI]
12
studied here has a melting temperature of around 80 °C, which is accessible for PFG-NMR equipment. The
temperature dependencies of cation and anion diffusion are presented in Figure 2 and
Supplementary Table 1, and ion mobile fraction is presented in Supplementary Figure 2B. The results
revealed that the drop in diffusion coefficient at phase transition from melt to Phase I is much smaller than
the drop in σ . The diffusion coefficient changes less than a factor of three between 363 and 348 K
DC
[Figure 2], while conductivity drops about two orders of magnitude in the same temperature range for the
aged sample and about three orders for the fresh sample. Analysis of NMR data also revealed that only
about 20% of all ions in the solid state have such high mobility. This decrease ~5 times in the fraction of
mobile ions between melt and Phase I is still not sufficient to explain more than 100 times drop in
conductivity.
LS
LS provides information about structural relaxation at high frequencies, related to the fluctuation of
polarizability. The LS spectra of [P ][TFSI] in the melted and solid Phase I state are shown in Figure 3. The
12
melted state spectrum shows a clear relaxation process, while in the solid phase, additional Brillouin lines
are presented. Polycrystallinity of the solid state leads to multiple light scattering that destroys the angle
selection rule, and Brillouin lines appear as multi-peak structures. However, at lower and high frequencies,
we can still detect the shoulder of the relaxation process and can estimate its position. We used Cole-
Davidson function to fit the relaxation processes and relaxation time can be estimated as τ = 1/(2πf ). The
LS
max
relaxation process in LS is associated with the structural dynamics, and our estimations give that
characteristic relaxation time of ~0.02 ns for a melted state and 0.01 ns for a solid state. These times
correspond to τ , extracted from the AC-DC crossover in conductivity spectra. At the same time, no
σ
signature of Process I is observed in the LS spectra.