
Page 86 - Read Online
P. 86
Kühn et al. Energy Mater 2023;3:300020 https://dx.doi.org/10.20517/energymater.2023.07 Page 7 of 14
-2
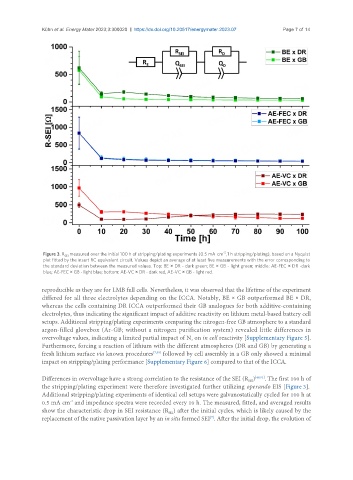
Figure 3. R measured over the initial 100 h of stripping/plating experiments (0.5 mA cm , 1 h stripping/plating), based on a Nyquist
SEI
plot fitted by the insert RC equivalent circuit. Values depict an average of at least five measurements with the error corresponding to
the standard deviation between the measured values. Top: BE × DR - dark green; BE × GB - light green; middle: AE-FEC × DR -dark
blue; AE-FEC × GB - light blue; bottom: AE-VC × DR - dark red, AE-VC × GB - light red.
reproducible as they are for LMB full cells. Nevertheless, it was observed that the lifetime of the experiment
differed for all three electrolytes depending on the ICCA. Notably, BE × GB outperformed BE × DR,
whereas the cells containing DR ICCA outperformed their GB analogues for both additive-containing
electrolytes, thus indicating the significant impact of additive reactivity on lithium metal-based battery cell
setups. Additional stripping/plating experiments comparing the nitrogen-free GB atmosphere to a standard
argon-filled glovebox (Ar-GB; without a nitrogen purification system) revealed little differences in
overvoltage values, indicating a limited partial impact of N on in cell reactivity [Supplementary Figure 5].
2
Furthermore, forcing a reaction of lithium with the different atmospheres (DR and GB) by generating a
fresh lithium surface via known procedures [7,39] followed by cell assembly in a GB only showed a minimal
impact on stripping/plating performance [Supplementary Figure 6] compared to that of the ICCA.
Differences in overvoltage have a strong correlation to the resistance of the SEI (R ) [48,51] . The first 100 h of
SEI
the stripping/plating experiment were therefore investigated further utilizing operando EIS [Figure 3].
Additional stripping/plating experiments of identical cell setups were galvanostatically cycled for 100 h at
0.5 mA cm and impedance spectra were recorded every 10 h. The measured, fitted, and averaged results
-2
show the characteristic drop in SEI resistance (R ) after the initial cycles, which is likely caused by the
SEI
replacement of the native passivation layer by an in situ formed SEI . After the initial drop, the evolution of
[7]