
Page 85 - Read Online
P. 85
Page 6 of 14 Kühn et al. Energy Mater 2023;3:300020 https://dx.doi.org/10.20517/energymater.2023.07
-2
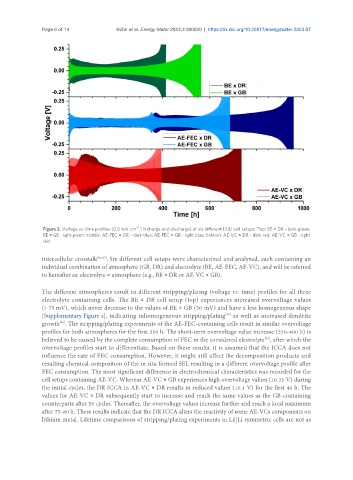
Figure 2. Voltage vs. time profiles (0.5 mA cm , 1 h charge and discharge) of six different Li||Li cell setups. Top: BE × DR - dark green,
BE × GB - light green; middle: AE-FEC × DR - dark blue; AE-FEC × GB - light blue; bottom: AE-VC × DR - dark red; AE-VC × GB - light
red.
intercellular crosstalk [46,47] . Six different cell setups were characterized and analyzed, each containing an
individual combination of atmosphere (GB, DR) and electrolyte (BE, AE-FEC, AE-VC), and will be referred
to hereafter as: electrolyte × atmosphere (e.g., BE × DR or AE-VC × GB).
The different atmospheres result in different stripping/plating (voltage vs. time) profiles for all three
electrolyte containing cells. The BE × DR cell setup (top) experiences increased overvoltage values
(> 75 mV), which never decrease to the values of BE × GB (50 mV) and have a less homogeneous shape
[48]
[Supplementary Figure 4], indicating inhomogeneous stripping/plating as well as increased dendrite
growth . The stripping/plating experiments of the AE-FEC-containing cells result in similar overvoltage
[49]
profiles for both atmospheres for the first 350 h. The short-term overvoltage value increase (350-400 h) is
believed to be caused by the complete consumption of FEC in the considered electrolyte , after which the
[50]
overvoltage profiles start to differentiate. Based on these results, it is assumed that the ICCA does not
influence the rate of FEC consumption. However, it might still affect the decomposition products and
resulting chemical composition of the in situ formed SEI, resulting in a different overvoltage profile after
FEC consumption. The most significant difference in electrochemical characteristics was recorded for the
cell setups containing AE-VC. Whereas AE-VC × GB experiences high overvoltage values (±0.25 V) during
the initial cycles, the DR ICCA in AE-VC × DR results in reduced values (±0.1 V) for the first 40 h. The
values for AE-VC × DR subsequently start to increase and reach the same values as the GB-containing
counterparts after 50 cycles. Thereafter, the overvoltage values increase further and reach a local maximum
after 75-80 h. These results indicate that the DR ICCA alters the reactivity of some AE-VCs components on
lithium metal. Lifetime comparisons of stripping/plating experiments in Li||Li symmetric cells are not as