
Page 190 - Read Online
P. 190
Page 6 of 12 Cui et al. Energy Mater 2023;3:300023 https://dx.doi.org/10.20517/energymater.2022.90
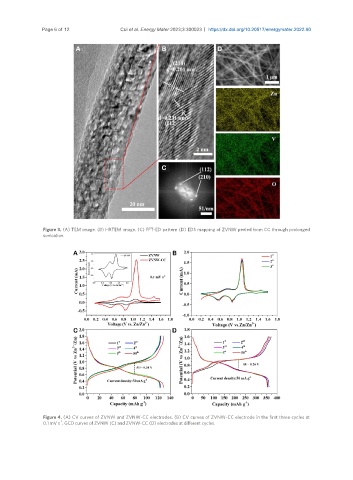
Figure 3. (A) TEM image. (B) HRTEM image. (C) FFT-ED pattern (D) EDS mapping of ZVNW peeled from CC through prolonged
sonication.
Figure 4. (A) CV curves of ZVNW and ZVNW-CC electrodes. (B) CV curves of ZVNW-CC electrode in the first three cycles at
-1
0.1 mV s . GCD curves of ZVNW (C) and ZVNW-CC (D) electrodes at different cycles.