
Page 188 - Read Online
P. 188
Page 4 of 12 Cui et al. Energy Mater 2023;3:300023 https://dx.doi.org/10.20517/energymater.2022.90
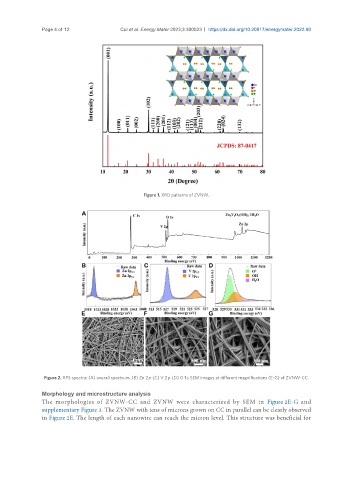
Figure 1. XRD patterns of ZVNW.
Figure 2. XPS spectra: (A) overall spectrum. (B) Zn 2p. (C) V 2p. (D) O 1s. SEM images at different magnifications (E-G) of ZVNW-CC.
Morphology and microstructure analysis
The morphologies of ZVNW-CC and ZVNW were characterized by SEM in Figure 2E-G and
supplementary Figure 3. The ZVNW with tens of microns grown on CC in parallel can be clearly observed
in Figure 2E. The length of each nanowire can reach the micron level. This structure was beneficial for