


Page 76 - Read Online
P. 76
Xia et al. Energy Mater. 2026, 6, 600022                                          Page 5 of 13


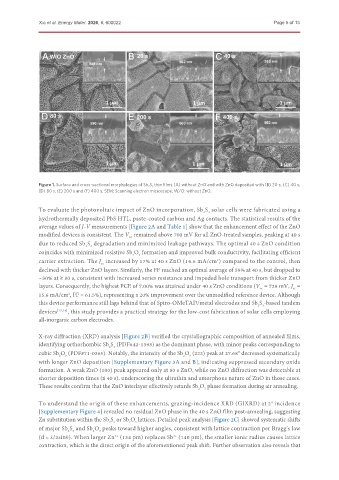
               Figure 1. Surface and cross-sectional morphologies of Sb 2 S 3  thin films (A) without ZnO and with ZnO deposited with (B) 20 s, (C) 40 s,
               (D) 80 s, (E) 200 s and (F) 400 s. SEM: Scanning electron microscope; W/O: without ZnO.


               To evaluate the photovoltaic impact of ZnO incorporation, Sb S  solar cells were fabricated using a
                                                                        2 3
               hydrothermally deposited PbS HTL, paste-coated carbon and Ag contacts. The statistical results of the
               average values of J-V measurements [Figure 2A and Table 1] show that the enhancement effect of the ZnO
               modified devices is consistent. The V  remained above 700 mV for all ZnO-treated samples, peaking at 40 s
                                              oc
               due to reduced Sb S  degradation and minimized leakage pathways. The optimal 40 s ZnO condition
                               2 3
               coincides with minimized resistive Sb O  formation and improved bulk conductivity, facilitating efficient
                                                  3
                                                2
               carrier extraction. The J  increased by 17% at 40 s ZnO (14.6 mA/cm ) compared to the control, then
                                                                             2
                                     sc
               declined with thicker ZnO layers. Similarly, the FF reached an optimal average of 59% at 40 s, but dropped to
               ~50% at ≥ 80 s, consistent with increased series resistance and impeded hole transport from thicker ZnO
               layers. Consequently, the highest PCE of 7.00% was attained under 40 s ZnO conditions (V  = 729 mV, J  =
                                                                                                        sc
                                                                                            oc
               15.6 mA/cm , FF = 61.5%), representing a 20% improvement over the unmodified reference device. Although
                         2
               this device performance still lags behind that of Spiro-OMeTAD/metal electrodes and Sb S -based tandem
                                                                                            2 3
               devices [17,18] , this study provides a practical strategy for the low-cost fabrication of solar cells employing
               all-inorganic carbon electrodes.

               X-ray diffraction (XRD) analysis [Figure 2B] verified the crystallographic composition of annealed films,
               identifying orthorhombic Sb S  (PDF#42-1393) as the dominant phase, with minor peaks corresponding to
                                       2 3
               cubic Sb O  (PDF#71-0365). Notably, the intensity of the Sb O  (222) peak at 27.68° decreased systematically
                                                                   3
                                                                 2
                      2
                        3
               with longer ZnO deposition [Supplementary Figure 3A and B], indicating suppressed secondary oxide
               formation. A weak ZnO (100) peak appeared only at 80 s ZnO, while no ZnO diffraction was detectable at
               shorter deposition times (≤ 40 s), underscoring the ultrathin and amorphous nature of ZnO in those cases.
               These results confirm that the ZnO interlayer effectively retards Sb O  phase formation during air annealing.
                                                                         3
                                                                       2
               To understand the origin of these enhancements, grazing-incidence XRD (GIXRD) at 2  incidence
                                                                                                o
               [Supplementary Figure 4] revealed no residual ZnO phase in the 40 s ZnO film post-annealing, suggesting
               Zn substitution within the Sb S  or Sb O  lattices. Detailed peak analysis [Figure 2C] showed systematic shifts
                                       2 3
                                              2
                                                3
               of major Sb S  and Sb O  peaks toward higher angles, consistent with lattice contraction per Bragg’s law
                         2 3
                                    3
                                  2
               (d = λ/2sinθ). When larger Zn  (134 pm) replaces Sb  (140 pm), the smaller ionic radius causes lattice
                                         2+
                                                              3+
               contraction, which is the direct origin of the aforementioned peak shift. Further observation also reveals that

