


Page 29 - Read Online
P. 29
Page 22 of 34                                                Wang et al. Energy Mater. 2026, 6, 600064


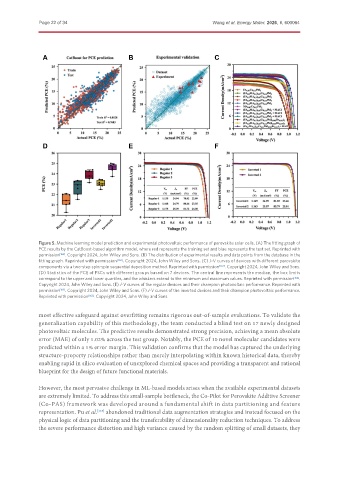
               Figure 5. Machine learning model prediction and experimental photovoltaic performance of perovskite solar cells. (A) The fitting graph of
               PCE results by the CatBoost-based algorithm model, where red represents the training set and blue represents the test set. Reprinted with
               permission [162] . Copyright 2024, John Wiley and Sons. (B) The distribution of experimental results and data points from the database in the
               fitting graph. Reprinted with permission [162] . Copyright 2024, John Wiley and Sons. (C) J-V curves of devices with different perovskite
               components via a two-step spin-spin sequential deposition method. Reprinted with permission [162] . Copyright 2024, John Wiley and Sons.
               (D) Statistics of the PCE of PSCs with different groups based on 7 devices. The central line represents the median, the box limits
               correspond to the upper and lower quartiles, and the whiskers extend to the minimum and maximum values. Reprinted with permission [162] .
               Copyright 2024, John Wiley and Sons. (E) J-V curves of the regular devices and their champion photovoltaic performance. Reprinted with
               permission [162] . Copyright 2024, John Wiley and Sons. (F) J-V curves of the inverted devices and their champion photovoltaic performance.
               Reprinted with permission [162] . Copyright 2024, John Wiley and Sons.


               most effective safeguard against overfitting remains rigorous out-of-sample evaluations. To validate the
               generalization capability of this methodology, the team conducted a blind test on 17 newly designed
               photovoltaic molecules. The predictive results demonstrated strong precision, achieving a mean absolute
               error (MAE) of only 1.02% across the test group. Notably, the PCE of 10 novel molecular candidates were
               predicted within a 1% error margin. This validation confirms that the model has captured the underlying
               structure-property relationships rather than merely interpolating within known historical data, thereby
               enabling rapid in silico evaluation of unexplored chemical spaces and providing a transparent and rational
               blueprint for the design of future functional materials.


               However, the most pervasive challenge in ML-based models arises when the available experimental datasets
               are extremely limited. To address this small-sample bottleneck, the Co-Pilot for Perovskite Additive Screener
               (Co-PAS) framework was developed around a fundamental shift in data partitioning and feature
               representation. Pu et al. [165]  abandoned traditional data augmentation strategies and instead focused on the
               physical logic of data partitioning and the transferability of dimensionality reduction techniques. To address
               the severe performance distortion and high variance caused by the random splitting of small datasets, they

