
Page 77 - Read Online
P. 77
Page 4 of 33 Mao et al. Chem Synth 2023;3:26 https://dx.doi.org/10.20517/cs.2022.41
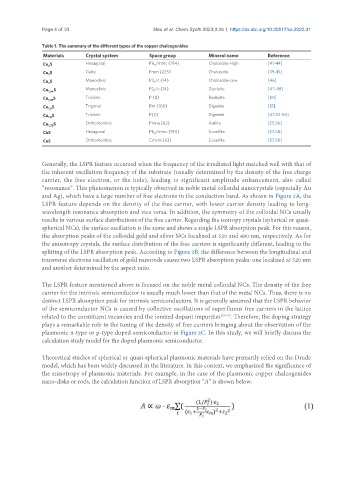
Table 1. The summary of the different types of the copper chalcogenides
Materials Crystal system Space group Mineral name Reference
Cu S Hexagonal P6 /mmc {194} Chalcocite-High [41-44]
3
2
Cu S Cubic Fmm {225} Chalcocite [39,45]
2
Cu S Monoclinic P2 /c {14} Chalcocite-Low [46]
1
2
Cu 1.94 S Monoclinic P2 /c {14} Djurleite [47-49]
1
Cu 1.81 S Triclinic P {2} Roxbyite [50]
Cu S Trigonal Rm {166} Digenite [51]
1.8
Cu S Triclinic P{2} Digenite [47,52-54]
1.8
Cu 1.75 S Orthorhombic Pnma {62} Anilite [55,56]
CuS Hexagonal P6 /mmc {194} Covellite [57,58]
3
CuS Orthorhombic Cmcm {63} Covellite [57,59]
Generally, the LSPR feature occurred when the frequency of the irradiated light matched well with that of
the inherent oscillation frequency of the substrate (usually determined by the density of the free charge
carrier, the free electron, or the hole), leading to significant amplitude enhancement, also called
“resonance”. This phenomenon is typically observed in noble metal colloidal nanocrystals (especially Au
and Ag), which have a large number of free electrons in the conduction band. As shown in Figure 2A, the
LSPR feature depends on the density of the free carrier, with lower carrier density leading to long-
wavelength resonance absorption and vice versa. In addition, the symmetry of the colloidal NCs usually
results in various surface distributions of the free carrier. Regarding the isotropy crystals (spherical or quasi-
spherical NCs), the surface oscillation is the same and shows a single LSPR absorption peak. For this reason,
the absorption peaks of the colloidal gold and silver NCs localized at 520 and 480 nm, respectively. As for
the anisotropy crystals, the surface distribution of the free carriers is significantly different, leading to the
splitting of the LSPR absorption peak. According to Figure 2B, the difference between the longitudinal and
transverse electrons oscillation of gold nanorods causes two LSPR absorption peaks: one localized at 520 nm
and another determined by the aspect ratio.
The LSPR feature mentioned above is focused on the noble metal colloidal NCs. The density of the free
carrier for the intrinsic semiconductor is usually much lower than that of the metal NCs. Thus, there is no
distinct LSPR absorption peak for intrinsic semiconductors. It is generally assumed that the LSPR behavior
of the semiconductor NCs is caused by collective oscillations of superfluous free carriers in the lattice
related to the constituent vacancies and the ionized dopant impurities [63-65] . Therefore, the doping strategy
plays a remarkable role in the tuning of the density of free carriers bringing about the observation of the
plasmonic n-type or p-type doped-semiconductor in Figure 2C. In this study, we will briefly discuss the
calculation study model for the doped plasmonic semiconductor.
Theoretical studies of spherical or quasi-spherical plasmonic materials have primarily relied on the Drude
model, which has been widely discussed in the literature. In this context, we emphasized the significance of
the anisotropy of plasmonic materials. For example, in the case of the plasmonic copper chalcogenides
nano-disks or rods, the calculation function of LSPR absorption “A” is shown below: