
Page 67 - Read Online
P. 67
Page 8 of 14 Liu et al. Chem Synth 2023;3:24 https://dx.doi.org/10.20517/cs.2023.13
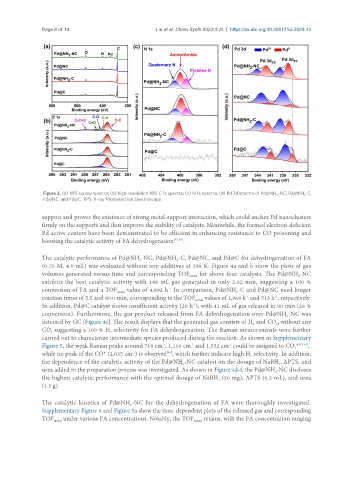
Figure 3. (a) XPS survey spectra; (b) high-resolution XPS C 1s spectra; (c) N 1s spectra; (d) Pd 3d spectra of Pd@NH -NC, Pd@NH -C,
2
2
Pd@NC, and Pd@C. XPS: X-ray Photoelectron Spectroscopy.
support and proves the existence of strong metal-support interaction, which could anchor Pd nanoclusters
firmly on the supports and thus improve the stability of catalysts. Meanwhile, the formed electron-deficient
Pd active centers have been demonstrated to be efficient in enhancing resistance to CO poisoning and
boosting the catalytic activity of FA dehydrogenation [45,46] .
The catalytic performance of Pd@NH -NC, Pd@NH -C, Pd@NC, and Pd@C for dehydrogenation of FA
2
2
(0.75 M, 4.0 mL) was evaluated without any additives at 298 K. Figure 4a and b show the plots of gas
volumes generated versus time and corresponding TOF initial for above four catalysts. The Pd@NH -NC
2
exhibits the best catalytic activity with 146 mL gas generated in only 2.92 min, suggesting a 100 %
conversion of FA and a TOF initial value of 4,892 h . In comparison, Pd@NH -C and Pd@NC need longer
-1
2
-1
reaction times of 5.5 and 80.0 min, corresponding to the TOF initial values of 1,968 h and 513 h , respectively.
-1
In addition, Pd@C catalyst shows insufficient activity (26 h ), with 41 mL of gas released in 90 min (28 %
-1
conversion). Furthermore, the gas product released from FA dehydrogenation over Pd@NH -NC was
2
detected by GC [Figure 4c]. The result displays that the generated gas consists of H and CO , without any
2
2
CO, suggesting a 100 % H selectivity for FA dehydrogenation. The Raman measurements were further
2
carried out to characterize intermediate species produced during the reaction. As shown in Supplementary
Figure 5, the weak Raman peaks around 718 cm , 1,116 cm and 1,552 cm could be assigned to CO * [47,48] ,
-1
-1
-1
2
[48]
while no peak of the CO* (2,035 cm ) is observed , which further indicate high H selectivity. In addition,
-1
2
the dependence of the catalytic activity of the Pd@NH -NC catalyst on the dosage of NaBH , APTS, and
4
2
urea added in the preparation process was investigated. As shown in Figure 4d-f, the Pd@NH -NC discloses
2
the highest catalytic performance with the optimal dosage of NaBH (30 mg), APTS (0.5 mL), and urea
4
(1.5 g).
The catalytic kinetics of Pd@NH -NC for the dehydrogenation of FA were thoroughly investigated.
2
Supplementary Figure 6 and Figure 5a show the time-dependent plots of the released gas and corresponding
TOF initial under various FA concentrations. Notably, the TOF initial retains, with the FA concentration ranging