
Page 66 - Read Online
P. 66
Liu et al. Chem Synth 2023;3:24 https://dx.doi.org/10.20517/cs.2023.13 Page 7 of 14
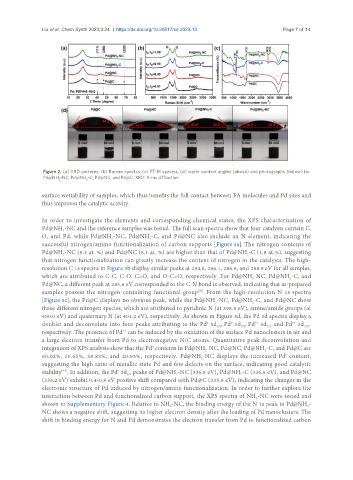
Figure 2. (a) XRD patterns; (b) Raman spectra; (c) FT-IR spectra; (d) water contact angles (above) and photographs (below) for
Pd@NH -NC, Pd@NH -C, Pd@NC, and Pd@C. XRD: X-ray diffraction.
2 2
surface wettability of samples, which thus benefits the full contact between FA molecules and Pd sites and
thus improves the catalytic activity.
In order to investigate the elements and corresponding chemical states, the XPS characterization of
Pd@NH -NC and the reference samples was tested. The full scan spectra show that four catalysts contain C,
2
O, and Pd, while Pd@NH -NC, Pd@NH -C, and Pd@NC also include an N element, indicating the
2
2
successful nitrogen/amino functionalization of carbon supports [Figure 3a]. The nitrogen contents of
Pd@NH -NC (9.2 at. %) and Pd@NC (8.1 at. %) are higher than that of Pd@NH -C (1.8 at.%), suggesting
2
2
that nitrogen functionalization can greatly increase the content of nitrogen in the catalysts. The high-
resolution C 1s spectra in Figure 3b display similar peaks at 284.8, 286.1, 286.6, and 288.9 eV for all samples,
which are attributed to C-C, C-O, C=O, and O-C=O, respectively. For Pd@NH -NC, Pd@NH -C, and
2
2
Pd@NC, a different peak at 285.6 eV corresponded to the C-N bond is observed, indicating that as-prepared
samples possess the nitrogen-containing functional group . From the high-resolution N 1s spectra
[43]
[Figure 3c], the Pd@C displays no obvious peak, while the Pd@NH -NC, Pd@NH -C, and Pd@NC show
2
2
three different nitrogen species, which are attributed to pyridinic N (at 398.8 eV), amine/amide groups (at
400.0 eV) and quaternary N (at 401.2 eV), respectively. As shown in Figure 3d, the Pd 3d spectra display a
0
0
2+
doublet and deconvolute into four peaks attributing to the Pd 3d , Pd 3d , Pd 3d and Pd 3d ,
2+
3/2
3/2
5/2
5/2
respectively. The presence of Pd can be induced by the oxidation of the surface Pd nanoclusters in air and
2+
a large electron transfer from Pd to electronegative N/C atoms. Quantitative peak deconvolution and
integration of XPS analysis show that the Pd contents in Pd@NH -NC, Pd@NC, Pd@NH -C, and Pd@C are
0
2
2
0
60.02%, 10.65%, 38.83%, and 20.93%, respectively. Pd@NH -NC displays the increased Pd content,
2
suggesting the high ratio of metallic state Pd and few defects on the surface, indicating good catalytic
0
[44]
stability . In addition, the Pd 3d peaks of Pd@NH -NC (336.6 eV), Pd@NH -C (336.6 eV), and Pd@NC
2
2
5/2
(336.2 eV) exhibit 0.4-0.8 eV positive shift compared with Pd@C (335.8 eV), indicating the changes in the
electronic structure of Pd induced by nitrogen/amino functionalization. In order to further explore the
interaction between Pd and functionalized carbon support, the XPS spectra of NH -NC were tested and
2
shown in Supplementary Figure 4. Relative to NH -NC, the binding energy of the N 1s peak in Pd@NH -
2
2
NC shows a negative shift, suggesting its higher electron density after the loading of Pd nanoclusters. The
shift in binding energy for N and Pd demonstrates the electron transfer from Pd to functionalized carbon