
Page 11 - Read Online
P. 11
Sathyan et al. Complex Eng Syst 2022;2:18 I http://dx.doi.org/10.20517/ces.2022.41 Page 7 of 12
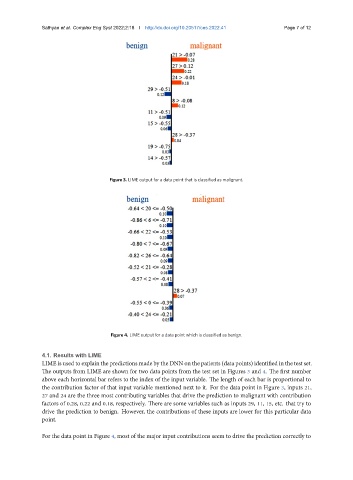
Figure 3. LIME output for a data point that is classified as malignant.
Figure 4. LIME output for a data point which is classified as benign.
4.1. Results with LIME
LIME is used to explain the predictions made by the DNN on the patients (data points) identified in the test set.
The outputs from LIME are shown for two data points from the test set in Figures 3 and 4. The first number
above each horizontal bar refers to the index of the input variable. The length of each bar is proportional to
the contribution factor of that input variable mentioned next to it. For the data point in Figure 3, inputs 21,
27 and 24 are the three most contributing variables that drive the prediction to malignant with contribution
factors of 0.28, 0.22 and 0.18, respectively. There are some variables such as inputs 29, 11, 15, etc. that try to
drive the prediction to benign. However, the contributions of these inputs are lower for this particular data
point.
For the data point in Figure 4, most of the major input contributions seem to drive the prediction correctly to