
Page 10 - Read Online
P. 10
Page 6 of 12 Sathyan et al. Complex Eng Syst 2022;2:18 I http://dx.doi.org/10.20517/ces.2022.41
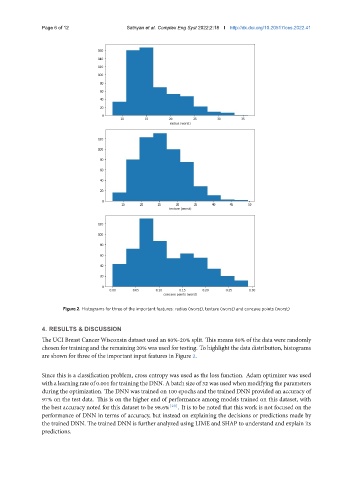
Figure 2. Histograms for three of the important features: radius (worst), texture (worst) and concave points (worst)
4. RESULTS & DISCUSSION
The UCI Breast Cancer Wisconsin dataset used an 80%-20% split. This means 80% of the data were randomly
chosen for training and the remaining 20% was used for testing. To highlight the data distribution, histograms
are shown for three of the important input features in Figure 2.
Since this is a classification problem, cross entropy was used as the loss function. Adam optimizer was used
with a learning rate of 0.001 for training the DNN. A batch size of 32 was used when modifying the parameters
during the optimization. The DNN was trained on 100 epochs and the trained DNN provided an accuracy of
97% on the test data. This is on the higher end of performance among models trained on this dataset, with
the best accuracy noted for this dataset to be 98.6% [29] . It is to be noted that this work is not focused on the
performance of DNN in terms of accuracy, but instead on explaining the decisions or predictions made by
the trained DNN. The trained DNN is further analyzed using LIME and SHAP to understand and explain its
predictions.