


Page 59 - 2417
P. 59
Page 12 of 22 François et al. Carbon Footprints 2026, 5, 22
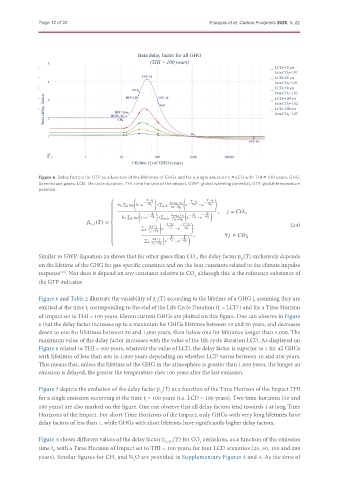
Figure 6. Delay factors for GTP as a function of the lifetimes of GHGs and for a single emission t i = LCD with THI = 100 years. GHG:
Greenhouse gases; LCD: life cycle duration; THI: time horizon of the impact; GWP: global warming potential; GTP: global temperature
potential.
! !
)−C 8 )−C 8
− )−C 8 −
Í Í 1 = @ : g = − g= −4
1 0 : @ : 1−4 3 : + 4 3 :
=,: g = −3 :
,
) ) 9 = $ 2
Í − Í 1 = @ : g = ) −
3 : + 4 − g = −4 3 :
1 0 : @ : 1−4 =,: g= −3 :
V 8, 9 ()) = )−C 8 )−C 8 ! (24)
Í @ : g 9 − g 9 −4 − 3 :
4
: g 9 −3 :
,
∀9 ≠ $ 2
) − )
Í @ : g 9 − g 9 −4
4 3 :
: g 9 −3 :
Similar to GWP, Equation 24 shows that for other gases than CO , the delay factor β (T) exclusively depends
2
i,j
on the lifetime of the GHG for gas-specific constants and on the four constants related to the climate impulse
response . Nor does it depend on any constants relative to CO although this is the reference substance of
[28]
2
the GTP indicator.
Figure 6 and Table 2 illustrate the variability of β (T) according to the lifetime of a GHG j, assuming they are
i,j
emitted at the time t corresponding to the end of the Life Cycle Duration (t = LCD ) and for a Time Horizon
i
i
of Impact set to THI = 100 years. Eleven current GHGs are plotted on this figure. One can observe in Figure
6 that the delay factor increases up to a maximum for GHGs lifetimes between 10 and 50 years, and decreases
down to one for lifetimes between 50 and 1,000 years, then below one for lifetimes longer than 1,000. The
maximum value of the delay factor increases with the value of the life cycle duration LCD. As displayed on
Figure 6 related to THI = 100 years, whatever the value of LCD, the delay factor is superior to 1 for all GHGs
with lifetimes of less than 600 to 1,000 years depending on whether LCD varies between 10 and 200 years.
This means that, unless the lifetime of the GHG in the atmosphere is greater than 1,000 years, the longer an
emission is delayed, the greater the temperature rises 100 years after the last emission.
Figure 7 depicts the evolution of the delay factor β (T) as a function of the Time Horizon of the Impact THI
i,j
for a single emission occurring at the time t = 100 years (i.e. LCD = 100 years). Two time-horizons (50 and
i
100 years) are also marked on the figure. One can observe that all delay factors tend towards 1 at long Time
Horizons of the Impact. For short Time Horizons of the Impact, only GHGs with very long lifetimes have
delay factors of less than 1, while GHGs with short lifetimes have significantly higher delay factors.
Figure 8 shows different values of the delay factor β i,CO2 (T) for CO emissions, as a function of the emission
2
time t, with a Time Horizon of Impact set to THI = 100 years, for four LCD scenarios (25, 50, 100 and 200
i
years). Similar figures for CH and N O are provided in Supplementary Figures 3 and 4. As the time of
2
4

