


Page 63 - 2417
P. 63
Page 16 of 22                                                                                                François et al. Carbon Footprints 2026, 5, 22


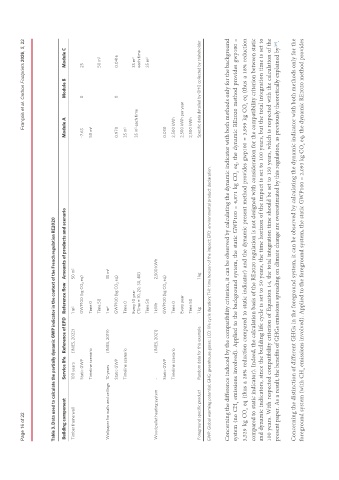
               Table 3. Data used to calculate the partially dynamic GWP indicator in the context of the French regulation RE2020
               Building component   Service life Reference of EPD Reference flow Amounts of products and scenario        Module A      Module B   Module C

               Timber frame wall    100 years  (INIES, 2022)  1 m 2    50 m 2
                                    Static GWP             GWP100 (kg CO 2  eq)                                          -7.63         0          25
                                    Timeline scenario      Time 0                                                        50 m 2
                                                           Time 50                                                                                50 m 2
               Wallpaper for walls and ceilings 10 years  (INIES, 2019)  1 m 2  35 m 2
                                    Static GWP             GWP100 (kg CO 2  eq)                                          0.970         0          0.0416
                                    Timeline scenario      Time 0                                                        35 m 2
                                                           Every 10 year                                                    2                     35 m 2
                                                           (Time = 10, 20, 30, 40)                                       35 m  each time          each time
                                                           Time 50                                                                                35 m 2
               Wood pellet heating system  -  (INIES, 2021)  1 kWh     2,500 kWh
                                    Static GWP             GWP100 (kg CO 2  eq)                                          0.030
                                    Timeline scenario      Time 0                                                        2,500 kWh
                                                           Every year                                                    2,500 kWh per year
                                                           Time 50                                                       2,500 kWh
               Foreground specific product  Random data for this example  1 kg  1 kg                                     Specific data detailed by GHG collected by stakeholder
               GWP: Global warming potential; GHG: greenhouse gases; LCD: life cycle duration; THI: time horizon of the impact; EPD: environmental product declaration.


               Concerning the difference induced by the compatibility criterion, it can be observed by calculating the dynamic indicator with both methods only for the background
               system (no CH  emissions involved). Applied to the background system, the static GWP100 = 4,871 kg CO  eq, the dynamic RE2020 method provides gwp100 =
                                                                                                             2
                            4
               3,529 kg CO  eq (thus a 28% reduction compared to static indicator) and the dynamic present method provides gwp100 = 3,999 kg CO  eq (thus a 18% reduction
                                                                                                                                     2
                          2
               compared to static indicator). Indeed, the calculation basis of the RE2020 regulation is not designed with consideration for the compatibility criterion between static
               and dynamic indicators, since the building life cycle is set to 50 years, the time horizon of the impact is set to 100 years, but the total integration time is set to
               100 years. With respected compatibility criterion of Equation 14, the total integration time should be set to 150 years, which is respected with the calculation of the
               present paper. As a result, the benefits of GHGs emissions spreading on climate change are overestimated by this regulation, as previously theoretically explained by .
                                                                                                                                                         [29]
               Concerning the distinction of different GHGs in the foreground system, it can be observed by calculating the dynamic indicator with both methods only for the
               foreground system (with CH  emissions involved). Applied to the foreground system, the static GWP100 = 2,093 kg CO  eq, the dynamic RE2020 method provides
                                        4
                                                                                                                       2

