


Page 60 - 2417
P. 60
François et al. Carbon Footprints 2026, 5, 22                                    Page 13 of 22


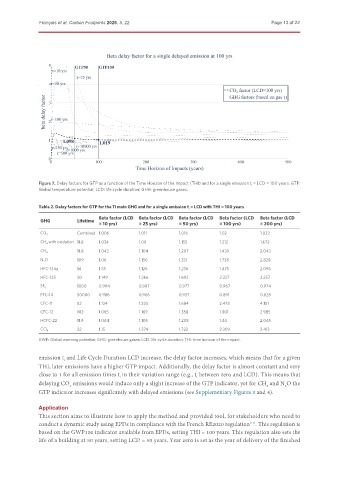
               Figure 7. Delay factors for GTP as a function of the Time Horizon of the Impact (THI) and for a single emission t i  = LCD = 100 years. GTP:
               Global temperature potential; LCD: life cycle duration; GHG: greenhouse gases.


               Table 2. Delay factors for GTP for the 11 main GHG and for a single emission t i  = LCD with THI = 100 years
                                    Beta factor (LCD  Beta factor (LCD  Beta factor (LCD  Beta factor (LCD  Beta factor (LCD
               GHG          Lifetime
                                    = 10 yrs)     = 25 yrs)     = 50 yrs)     = 100 yrs)    = 200 yrs)
                            Combined 1.006        1.011         1.016         1.02          1.032
               CO 2
               CH 4  with oxidation 11.8  1.034   1.08          1.155         1.312         1.672
                            11.8    1.043         1.104         1.207         1.439         2.043
               CH 4
               N 2 O        109     1.06          1.156         1.331         1.738         2.828
               HFC-134a     14      1.55          1.126         1.236         1.475         2.095
               HFC-125      30      1.149         1.366         1.692         2.227         3.257
                            1000    0.994         0.987         0.977         0.967         0.974
               SF 6
               PFC-14       50000   0.986         0.966         0.937         0.891         0.828
               CFC-11       52      1.124         1.323         1.684         2.473         4.151
               CFC-12       102     1.065         1.169         1.358         1.801         2.985
               HCFC-22      11.9    1.044         1.105         1.208         1.44          2.045
                            32      1.15          1.374         1.722         2.309         3.413
               CCl 4
               GWP: Global warming potential; GHG: greenhouse gases; LCD: life cycle duration; THI: time horizon of the impact.

               emission t and Life Cycle Duration LCD increase, the delay factor increases, which means that for a given
                        i
               THI, later emissions have a higher GTP impact. Additionally, the delay factor is almost constant and very
               close to 1 for all emission times t in their variation range (e.g., t between zero and LCD). This means that
                                                                      i
                                           i
               delaying CO  emissions would induce only a slight increase of the GTP indicator, yet for CH  and N O the
                                                                                                     2
                         2
                                                                                               4
               GTP indicator increases significantly with delayed emissions (see Supplementary Figures 3 and 4).
               Application
               This section aims to illustrate how to apply the method and provided tool, for stakeholders who need to
               conduct a dynamic study using EPDs in compliance with the French RE2020 regulation . This regulation is
                                                                                         [11]
               based on the GWP100 indicator available from EPDs, setting THI = 100 years. This regulation also sets the
               life of a building at 50 years, setting LCD = 50 years. Year zero is set as the year of delivery of the finished

