


Page 36 - 2417
P. 36
Page 12 of 23                                                 Chaib et al. Carbon Footprints 2026, 5, 23


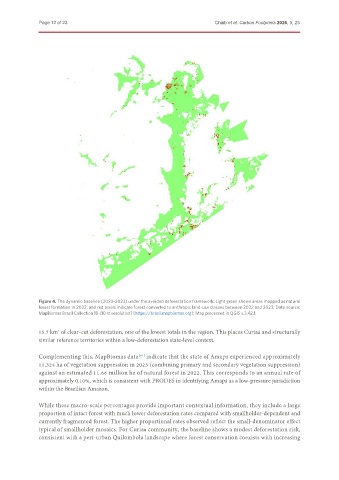
               Figure 4. The dynamic baseline (2022-2023) under the avoided deforestation framework. Light green shows areas mapped as natural
               forest formation in 2022, and red pixels indicate forest converted to anthropic land-use classes between 2022 and 2023. Data source:
               MapBiomas Brazil Collection 10 (10 m resolution) (https://brasil.mapbiomas.org); Map processed in QGIS v.3.42.1.


               15.7 km  of clear-cut deforestation, one of the lowest totals in the region. This places Curiaú and structurally
                     2
               similar reference territories within a low-deforestation state-level context.

               Complementing this, MapBiomas data  indicate that the state of Amapá experienced approximately
                                                  [61]
               11,324 ha of vegetation suppression in 2023 (combining primary and secondary vegetation suppression)
               against an estimated 11.66 million ha of natural forest in 2022. This corresponds to an annual rate of
               approximately 0.10%, which is consistent with PRODES in identifying Amapá as a low-pressure jurisdiction
               within the Brazilian Amazon.


               While these macro-scale percentages provide important contextual information, they include a large
               proportion of intact forest with much lower deforestation rates compared with smallholder-dependent and
               currently fragmented forest. The higher proportional rates observed reflect the small-denominator effect
               typical of smallholder mosaics. For Curiaú community, the baseline shows a modest deforestation risk,
               consistent with a peri-urban Quilombola landscape where forest conservation coexists with increasing

