
Page 33 - Read Online
P. 33
Page 984 Lee et al. Cancer Drug Resist 2020;3:980-91 I http://dx.doi.org/10.20517/cdr.2020.73
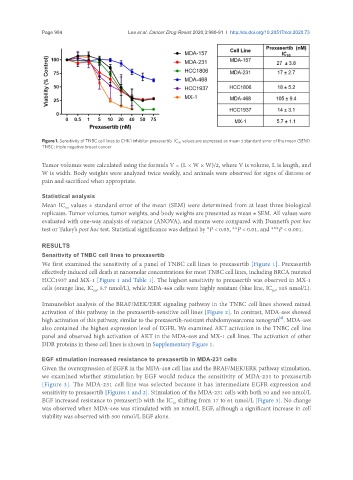
Figure 1. Sensitivity of TNBC cell lines to CHK1 inhibitor prexasertib. IC 50 values are expressed as mean ± standard error of the mean (SEM).
TNBC: triple negative breast cancer
Tumor volumes were calculated using the formula V = (L × W × W)/2, where V is volume, L is length, and
W is width. Body weights were analyzed twice weekly, and animals were observed for signs of distress or
pain and sacrificed when appropriate.
Statistical analysis
Mean IC values ± standard error of the mean (SEM) were determined from at least three biological
50
replicates. Tumor volumes, tumor weights, and body weights are presented as mean ± SEM. All values were
evaluated with one-way analysis of variance (ANOVA), and means were compared with Dunnett’s post hoc
test or Tukey’s post hoc test. Statistical significance was defined by *P < 0.05, **P < 0.01, and ***P < 0.001.
RESULTS
Sensitivity of TNBC cell lines to prexasertib
We first examined the sensitivity of a panel of TNBC cell lines to prexasertib [Figure 1]. Prexasertib
effectively induced cell death at nanomolar concentrations for most TNBC cell lines, including BRCA mutated
HCC1937 and MX-1 [Figure 1 and Table 1]. The highest sensitivity to prexasertib was observed in MX-1
cells (orange line, IC , 5.7 nmol/L), while MDA-468 cells were highly resistant (blue line, IC , 105 nmol/L).
50
50
Immunoblot analysis of the BRAF/MEK/ERK signaling pathway in the TNBC cell lines showed mixed
activation of this pathway in the prexasertib-sensitive cell lines [Figure 2]. In contrast, MDA-468 showed
high activation of this pathway, similar to the prexasertib-resistant rhabdomyosarcoma xenograft . MDA-468
[8]
also contained the highest expression level of EGFR. We examined AKT activation in the TNBC cell line
panel and observed high activation of AKT in the MDA-468 and MX-1 cell lines. The activation of other
DDR proteins in these cell lines is shown in Supplementary Figure 1.
EGF stimulation increased resistance to prexasertib in MDA-231 cells
Given the overexpression of EGFR in the MDA-468 cell line and the BRAF/MEK/ERK pathway stimulation,
we examined whether stimulation by EGF would reduce the sensitivity of MDA-231 to prexasertib
[Figure 3]. The MDA-231 cell line was selected because it has intermediate EGFR expression and
sensitivity to prexasertib [Figures 1 and 2]. Stimulation of the MDA-231 cells with both 50 and 500 nmol/L
EGF increased resistance to prexasertib with the IC shifting from 17 to 61 nmol/L [Figure 3]. No change
50
was observed when MDA-468 was stimulated with 50 nmol/L EGF, although a significant increase in cell
viability was observed with 500 nmol/L EGF alone.