
Page 48 - Read Online
P. 48
Page 6 Shapey et al. Art Int Surg 2023;3:1-13 https://dx.doi.org/10.20517/ais.2022.31
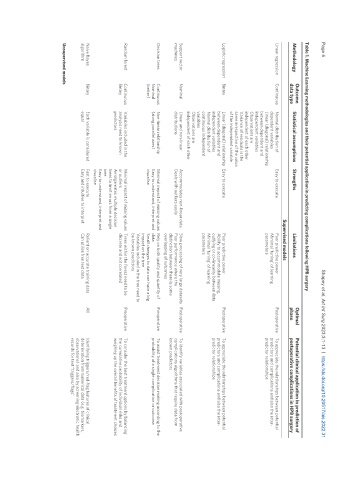
Table 1. Machine Learning methodologies and their potential application in predicting complications following HPB surgery
Outcome Optimal Potential clinical application in prediction of
Methodology Statistical assumptions Strengths Limitations
data type phase postoperative complications in HPB surgery
Supervised models
Linear regression Continuous Normal distribution of Easy to execute Poor predictive power Postoperative To appreciate the relationships between potential
dependent variables Minimal ‘tuning’ of learning predictors and complications and also the inter-
Linear (diagonal) relationship parameters predictor relationships
between dependent and
independent variables
Observations are
independent of each other
Variance of residuals is the
same irrespective of the value
of the independent variable
Logistic regression Binary Linear (diagonal) relationship Easy to execute Poor predictive power Postoperative To appreciate the relationships between potential
between dependent and Ability to accommodate missing, predictors and complications and also the inter-
independent variables outlying or co-linearity between data predictor relationships
Normal distribution of Minimal ‘tuning’ of learning
continuous independent parameters
variables
Observations are
independent of each other
Support vector Nominal Linear and non-linear Accommodates non-linear data Slow processing of very large datasets Postoperative To identify variables associated with postoperative
machines distributions Deals with outliers easily Poor performance where the complications algorithms that require data from
distinction between there is some known predictors
overlapping of outcomes
Decision trees Continuous Non-linear relationship Minimal impact of missing values Rely on both quality and quantity of Preoperative To assist treatment decision making according to the
Nominal (along parallel axes) Easy to understand, interpret and data probability of a single complication or outcome
(better) visualise Small changes to data can have a big
impact on the tree
Variables included in the tree need to
be known predictors
Random forest Continuous Variables included in the Minimal impact of missing values Trees within the forest need to be Preoperative To consider the best treatment options by balancing
Binary analysis need to known or outliers discrete and not correlated the cumulative probability of individual risks and
predictors Amalgamates multiple decision weighing up the overall benefits of treatment choices
trees to limit errors from a single
tree
Easy to understand, interpret and
visualise
Naive Bayes Binary Each variable is considered Fast to execute Reliant on accurate training data All Identifying triggers/red-flag features of clinical
algorithm equal Easy and intuitive to interpret Can utilise free text data deterioration from numerical data (e.g. biomarkers,
observations) and also by screening electronic health
records for text “triggers/flags”
Unsupervised models