
Page 286 - Read Online
P. 286
Zhou et al. Microstructures 2023;3:2023043 https://dx.doi.org/10.20517/microstructures.2023.38 Page 3 of 23
Figure 1. Numbers of Web of Science publications by year using a search term of “atom probe”.
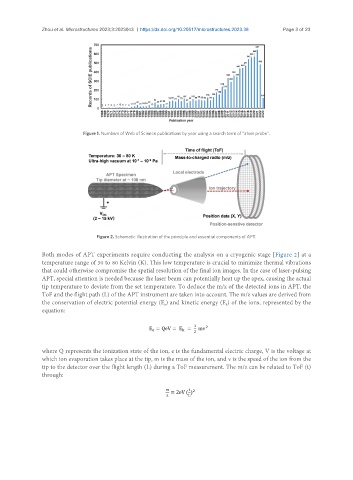
Figure 2. Schematic illustration of the principle and essential components of APT.
Both modes of APT experiments require conducting the analysis on a cryogenic stage [Figure 2] at a
temperature range of 30 to 80 Kelvin (K). This low temperature is crucial to minimize thermal vibrations
that could otherwise compromise the spatial resolution of the final ion images. In the case of laser-pulsing
APT, special attention is needed because the laser beam can potentially heat up the apex, causing the actual
tip temperature to deviate from the set temperature. To deduce the m/z of the detected ions in APT, the
ToF and the flight path (L) of the APT instrument are taken into account. The m/z values are derived from
the conservation of electric potential energy (E ) and kinetic energy (E ) of the ions, represented by the
k
e
equation:
where Q represents the ionization state of the ion, e is the fundamental electric charge, V is the voltage at
which ion evaporation takes place at the tip, m is the mass of the ion, and v is the speed of the ion from the
tip to the detector over the flight length (L) during a ToF measurement. The m/z can be related to ToF (t)
through: