
Page 192 - Read Online
P. 192
Page 4 of 30 Guo et al. Microstructures 2023;3:2023038 https://dx.doi.org/10.20517/microstructures.2023.30
Figure 1. Schematic diagram of the classification of SMABs and ORR/OER electrocatalysts. (Reproduced with permission [91] . Copyright
2021, Elsevier; Reproduced with permission [92] . Copyright 2011, Wiley-VCH; Reproduced with permission [97] . Copyright 2017, Elsevier;
Reproduced with permission [99] . Copyright 2021, Wiley-VCH; Reproduced with permission [104] . Copyright 2020, American Chemical
Society; Reproduced with permission [128] . Copyright 2022, WILEY-VCH; Reproduced with permission [127] . Copyright 2022, WILEY-VCH;
Reproduced with permission [121] . Copyright 2019, PNAS; Reproduced with permission [120] . Copyright 2019, Springer Nature; Reproduced
with permission [114] . Copyright 2016, Wiley-VCH).
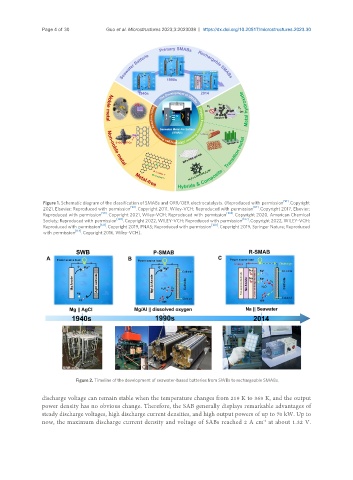
Figure 2. Timeline of the development of seawater-based batteries from SWBs to rechargeable SMABs.
discharge voltage can remain stable when the temperature changes from 219 K to 369 K, and the output
power density has no obvious change. Therefore, the SAB generally displays remarkable advantages of
steady discharge voltages, high discharge current densities, and high output powers of up to 70 kW. Up to
-2
now, the maximum discharge current density and voltage of SABs reached 2 A cm at about 1.32 V.