
Page 160 - Read Online
P. 160
Page 8 of 12 Wang et al. Microstructures 2023;3:2023036 https://dx.doi.org/10.20517/microstructures.2023.27
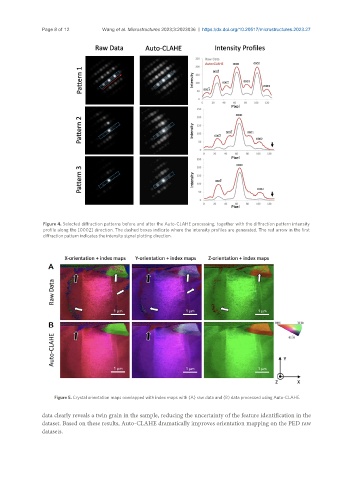
Figure 4. Selected diffraction patterns before and after the Auto-CLAHE processing, together with the diffraction pattern intensity
profile along the [0002] direction. The dashed boxes indicate where the intensity profiles are generated. The red arrow in the first
diffraction pattern indicates the intensity signal plotting direction.
Figure 5. Crystal orientation maps overlapped with index maps with (A) raw data and (B) data processed using Auto-CLAHE.
data clearly reveals a twin grain in the sample, reducing the uncertainty of the feature identification in the
dataset. Based on these results, Auto-CLAHE dramatically improves orientation mapping on the PED raw
datasets.