
Page 158 - Read Online
P. 158
Page 6 of 12 Wang et al. Microstructures 2023;3:2023036 https://dx.doi.org/10.20517/microstructures.2023.27
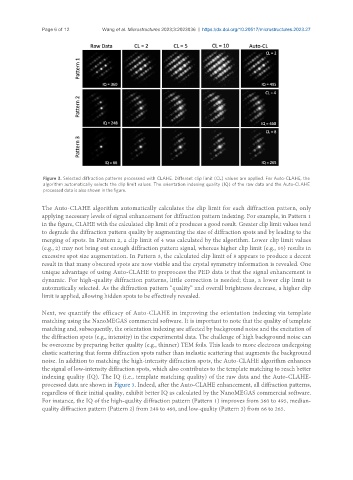
Figure 3. Selected diffraction patterns processed with CLAHE. Different clip limit (CL) values are applied. For Auto-CLAHE, the
algorithm automatically selects the clip limit values. The orientation indexing quality (IQ) of the raw data and the Auto-CLAHE
processed data is also shown in the figure.
The Auto-CLAHE algorithm automatically calculates the clip limit for each diffraction pattern, only
applying necessary levels of signal enhancement for diffraction pattern indexing. For example, in Pattern 1
in the figure, CLAHE with the calculated clip limit of 2 produces a good result. Greater clip limit values tend
to degrade the diffraction pattern quality by augmenting the size of diffraction spots and by leading to the
merging of spots. In Pattern 2, a clip limit of 4 was calculated by the algorithm. Lower clip limit values
(e.g., 2) may not bring out enough diffraction pattern signal, whereas higher clip limit (e.g., 10) results in
excessive spot size augmentation. In Pattern 3, the calculated clip limit of 8 appears to produce a decent
result in that many obscured spots are now visible and the crystal symmetry information is revealed. One
unique advantage of using Auto-CLAHE to preprocess the PED data is that the signal enhancement is
dynamic. For high-quality diffraction patterns, little correction is needed; thus, a lower clip limit is
automatically selected. As the diffraction pattern “quality” and overall brightness decrease, a higher clip
limit is applied, allowing hidden spots to be effectively revealed.
Next, we quantify the efficacy of Auto-CLAHE in improving the orientation indexing via template
matching using the NanoMEGAS commercial software. It is important to note that the quality of template
matching and, subsequently, the orientation indexing are affected by background noise and the excitation of
the diffraction spots (e.g., intensity) in the experimental data. The challenge of high background noise can
be overcome by preparing better quality (e.g., thinner) TEM foils. This leads to more electrons undergoing
elastic scattering that forms diffraction spots rather than inelastic scattering that augments the background
noise. In addition to matching the high-intensity diffraction spots, the Auto-CLAHE algorithm enhances
the signal of low-intensity diffraction spots, which also contributes to the template matching to reach better
indexing quality (IQ). The IQ (i.e., template matching quality) of the raw data and the Auto-CLAHE-
processed data are shown in Figure 3. Indeed, after the Auto-CLAHE enhancement, all diffraction patterns,
regardless of their initial quality, exhibit better IQ as calculated by the NanoMEGAS commercial software.
For instance, the IQ of the high-quality diffraction pattern (Pattern 1) improves from 360 to 495, median-
quality diffraction pattern (Pattern 2) from 248 to 460, and low-quality (Pattern 3) from 66 to 265.