
Page 156 - Read Online
P. 156
Page 4 of 12 Wang et al. Microstructures 2023;3:2023036 https://dx.doi.org/10.20517/microstructures.2023.27
The user interface of the algorithm is described as follows. First, the user selects a PED dataset. Next, an
analysis window containing a virtual bright-field image of the selected dataset appears. The virtual bright-
field image is created by taking the average intensity of the direct beam in the diffraction patterns of each
pixel. The user can click on any point on the virtual bright-field (VBF) image to preview the raw and
enhanced diffraction pattern at that pixel. Finally, the entire dataset is enhanced with Auto-CLAHE and
exported as a new .blo file, which can be further analyzed using the NanoMEGAS commercial software.
RESULTS AND DISCUSSION
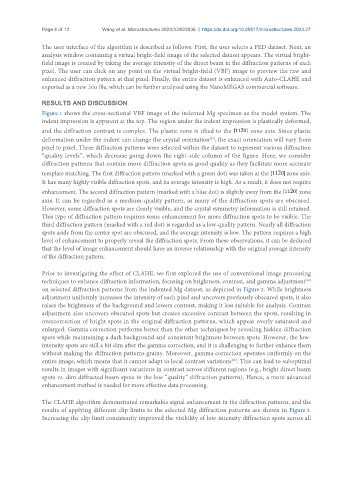
Figure 1 shows the cross-sectional VBF image of the indented Mg specimen as the model system. The
indent impression is apparent at the top. The region under the indent impression is plastically deformed,
and the diffraction contrast is complex. The plastic zone is tilted to the zone axis. Since plastic
[25]
deformation under the indent can change the crystal orientation , the exact orientation will vary from
pixel to pixel. Three diffraction patterns were selected within the dataset to represent various diffraction
“quality levels”, which decrease going down the right-side column of the figure. Here, we consider
diffraction patterns that contain more diffraction spots as good quality as they facilitate more accurate
template matching. The first diffraction pattern (marked with a green dot) was taken at the zone axis.
It has many highly visible diffraction spots, and its average intensity is high. As a result, it does not require
enhancement. The second diffraction pattern (marked with a blue dot) is slightly away from the zone
axis. It can be regarded as a medium-quality pattern, as many of the diffraction spots are obscured.
However, some diffraction spots are clearly visible, and the crystal symmetry information is still retained.
This type of diffraction pattern requires some enhancement for more diffraction spots to be visible. The
third diffraction pattern (marked with a red dot) is regarded as a low-quality pattern. Nearly all diffraction
spots aside from the center spot are obscured, and the average intensity is low. The pattern requires a high
level of enhancement to properly reveal the diffraction spots. From these observations, it can be deduced
that the level of image enhancement should have an inverse relationship with the original average intensity
of the diffraction pattern.
Prior to investigating the effect of CLAHE, we first explored the use of conventional image processing
[26]
techniques to enhance diffraction information, focusing on brightness, contrast, and gamma adjustment
on selected diffraction patterns from the indented Mg dataset, as depicted in Figure 2. While brightness
adjustment uniformly increases the intensity of each pixel and uncovers previously obscured spots, it also
raises the brightness of the background and lowers contrast, making it less suitable for analysis. Contrast
adjustment also uncovers obscured spots but creates excessive contrast between the spots, resulting in
overcorrection of bright spots in the original diffraction patterns, which appear overly saturated and
enlarged. Gamma correction performs better than the other techniques by revealing hidden diffraction
spots while maintaining a dark background and consistent brightness between spots. However, the low-
intensity spots are still a bit dim after the gamma correction, and it is challenging to further enhance them
without making the diffraction patterns grainy. Moreover, gamma correction operates uniformly on the
entire image, which means that it cannot adapt to local contrast variations . This can lead to suboptimal
[26]
results in images with significant variations in contrast across different regions (e.g., bright direct beam
spots vs. dim diffracted beam spots in the low “quality” diffraction patterns). Hence, a more advanced
enhancement method is needed for more effective data processing.
The CLAHE algorithm demonstrated remarkable signal enhancement in the diffraction patterns, and the
results of applying different clip limits to the selected Mg diffraction patterns are shown in Figure 3.
Increasing the clip limit consistently improved the visibility of low-intensity diffraction spots across all